Earth’s climate has been changing for many decades. Now, the world is threatened by three effects of the change.
By the time today’s children have become the adults in authority, they will face a world unbelievably different from ours, today. These changes will fundamentally affect where we will live and how we will survive and interact with each other.
The world is changing. If we are lucky, the change might require 60 or 70 more years. If unlucky, if the change is too rapid, the environment could be pushed into a chaotic jump … a sudden change into a much warmer, more violent reality. As our first sentence indicates, this challenging scenario feels unbelievable. Some people alive now will never accept it – their babies today, grown into adults tomorrow, are the ones forced to cope.
Here, we discuss the 3 effects actually happening due to change. In another post, we will discuss human response to all this.
- The global mean temperature will rise, some places much hotter, others perhaps cooler. || For example, destroy the Atlantic circulation and Europe could lose its winter warmth.
- Global mean sea level will rise, and ocean shore lines will retreat. Expect a sea level rise of between 30 cm (1 foot) and 7 meters (23 ft). || LESSER effect with smooth temperature growth to less than 2 ºC; GREATER effect with collapse of the West Antarctic ice shelf and melt of the Greenland glaciers (probably with temperature change exceeding 2º C).
- Storms will become much more violent, though probably not more frequent. || Rate of rise for ‘storms-per-year’ will be much lower than the damage-per-storm rate.
The question ought to be about how the people of the Earth work with the results, but we will discuss here : what is happening now?
The changes have started, now
Those “will” words in the bullets sound dogmatic; but the change is happening – not the “just-you-wait, you’ll be sorry” soon, but in current now. World temperatures are going up; local air temperatures are rising, which puts into question the survival of the local residents. Water temperatures are rising, have risen for decades. This is making ocean storms more energetic and shore life miserable. Heating is penetrating deeper below ocean surfaces, and is causing grounded icebergs everywhere to melt at the bottom where they rest on land. This melt at the base has accelerated the rise in the sea levels for as long as reliable records have existed (back to the mid 1800s).
Temperature ( T ) extremes are growing
T changes make up the easiest effect to notice. But, Who cares? It was awfully hot when I was young. Fact: as a boy in Kentucky I vividly recall summer time highs of 104º F or 40º C. (We will abbreviate that as 104F/\40C .) But projections now say that if we do nothing, it could reach 122F/\50C.
Suppose that you live in one of Earth’s cities that have already reported afternoon T of 122F/\50C. If you can imagine this, you are ready for the Guardian’s vivid article Halfway To Boiling. These cities exist today. I have place them on my personal watch list for end-of-century kill zone cities reaching 140F/\60C .
And as you read, bear in mind … steak is served “medium-rare” (tender and choice) when it reaches (130-135)F/\(54-57)C.

Fig 1 Jason Samenow –
Washington Post
Washington Post editor, Jason Samenow, (Fig 1) publishes reports on World Ts. The Samenow sampler –
- May 2017: Turbat, Pakistan (25 N lat)– 128F/\53.7C world record for May and tied for hottest ever in Pakistan.
- April 2018: Pakistan (24-37 N lat) posted its highest T in April, ever … 122F/\50.2C.
- Jun 2018: Qurayat, Oman (23 N lat) recorded its highest daily LOW temperature, 108.7F/\42.6C
- July 2017: Cordoba, Spain (38 N lat)– 116F/\46.9C hottest up to that time in Spain
Fig 2 is based on a Google Maps image, and shows Qurayat and Turbat. The Tropic of Cancer (northern boundary of the tropics) passes between them.
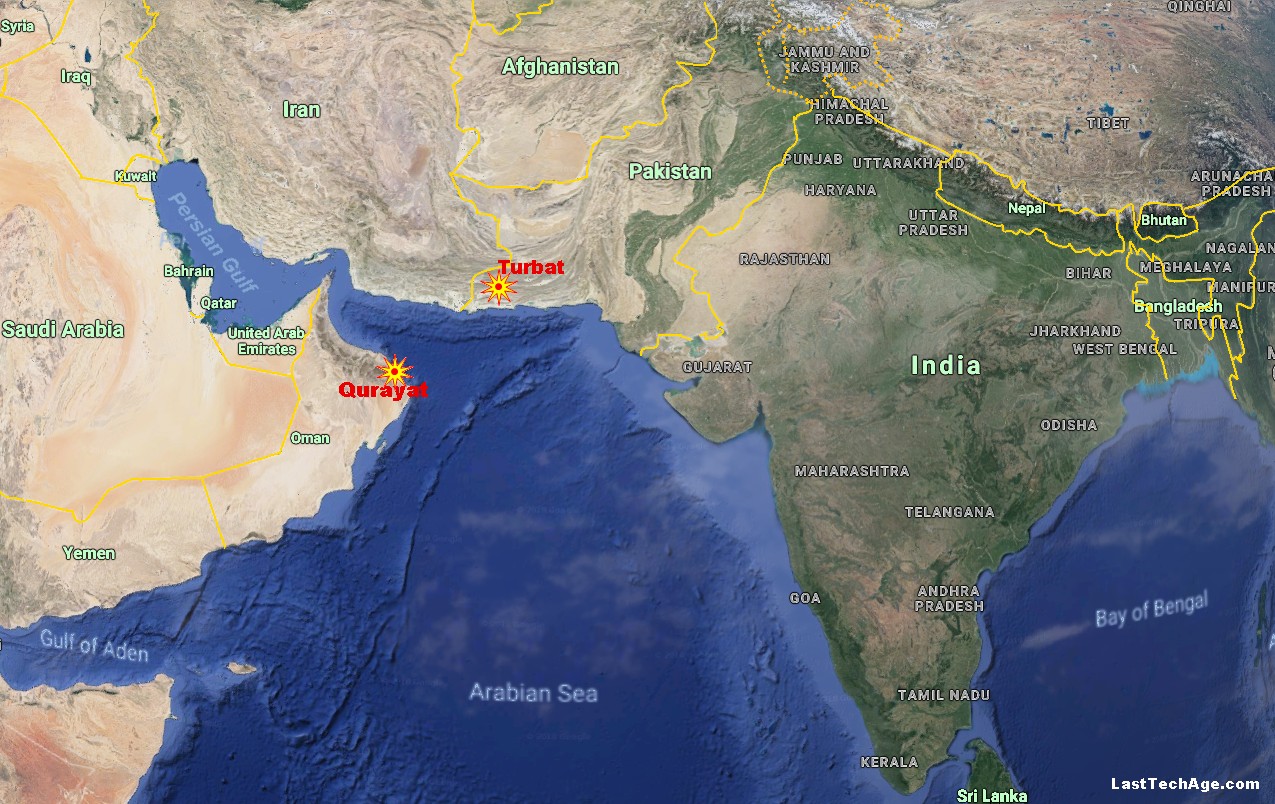
Fig 2 Turbat and Qurayat both set T records in the 2017-2018 time frame.we
These may be superseded by the time you read this (see, for example, Records in Japan NYT 2018-07-27 ), or World records 2018-08-07).
So – why is 40 ºC and higher so dangerous? Quick answer – because as body T rises above 104F/\40C the death rate goes up fast.
Long answer – Body temperature is about 98.6F/\37C and cells begin to die when their actual T rises (2 to 3 ºC )/\(4 to 6 ºF) above the body norm. But healthy people survive in an even hotter rooms, so…
Real Question: How long can any person survive at a higher T?
Answer: It is the cell’s own temperature that kills it, not the room’s T. Survival depends on how long the body’s “air conditioner” can function and keep body core T stable. Two effects cooperate to defeat the body’s self cooling mechanism.
- As ambient T rises, energy transfers from the room into the cell at ever higher rates.
- As relative humidity (RH) increases, the time to shed excess body heat grows longer. The process for cooling (evaporation of sweat) slows down.
At any elevated T value, we all lose as the RH rises. At any RH, an ambient T of 140F/\60C (steak cooked “medium”) will cause everyone to have lost control of core temperature.
Extremely important, but hardly ever discussed are food supplies that are endangered and if world mean temperature continues to rise, it will impact us all. Two examples–
Phytoplankton (phyto) are tiny algae that ingest nutrients and need sunlight to grow. They live in the meters just below ocean surfaces where sunlight penetrates. In a balanced eco-system, phyto are the foundation of the food chain: everything we eat has eaten something that eats …etc… something that eats phyto. The issue is that the increasing water temperature is killing these creatures. Kill the mid-ocean phyto, and much life in the oceans will disappear. As important – phyto produce half or more of the oxygen used by all life.
![]() Insects thrive with rising temperatures. Insects leave winter dormancy according to the temperature (actually degree-days) and are active earlier today than 50 years ago … and, 50 years from now? Cut through convoluted interwoven chains of interactions: early insect development is bad news for things that grow. In the Spring, tree borers start damage earlier than bird populations reappear (in the temperate zones). Caterpillars attack crops at an earlier, more vulnerable stage. We should expect “biblical” plagues of pest insects to become a major problem for feeding the growing human population.
Insects thrive with rising temperatures. Insects leave winter dormancy according to the temperature (actually degree-days) and are active earlier today than 50 years ago … and, 50 years from now? Cut through convoluted interwoven chains of interactions: early insect development is bad news for things that grow. In the Spring, tree borers start damage earlier than bird populations reappear (in the temperate zones). Caterpillars attack crops at an earlier, more vulnerable stage. We should expect “biblical” plagues of pest insects to become a major problem for feeding the growing human population.
Sea shores retreat as Sea Level Rise (SLR) grows
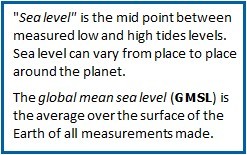
Comment A Sea Level
The global mean sea level (GMSL) is steadily rising. and sea shores are retreating inland, everywhere. See Comment A
One feature that stands out is that the GMSL is been rising and has been since at least 1870 when systematic measurements were begun. What has changed is that the rate-of-rise is increasing.
SLR is mostly due to 3 effects
- Melting of ice that is not floating (resting on land). Although hard to model, a glacier’s sliding motion toward the sea is very real.
- Melting of floating ice (small contribution since the density of sea ice is close to that of sea water).
- Expansion of water as it warms. Water is most dense and takes the least volume at 4C/\39F. Water expands both as it cools from 4ºC to its ice point (below 0º C for oceans) where it solidifies, or warms toward its boiling point, 100º C. Over the past 2 decades, ocean water has warmed, has risen to the surface, and its volume has expanded. SLR is affected by this, but it is small compared to effects 1 and 2. The greatest concern is due to deadly effect ocean heating has on all life that dwell within it.

Fig 3 Low-lying barrier islands are the first place to look for sea level rising.
Fig 3 shows a National Park barrier island, under SLR attack. The island is along our East Coast.
The West Antarctica ice sheet is a cantilevered shelf in the ocean, but not floating. Its ground support base is known to be eroding due to the ever-warming Southern Ocean.
Case I – Best the ice shelf gently melts away, slowly contributing to SLR over the next century or more. The current 20 year average is (1/8″)/\(3 mm) per year, slower at start and faster today (NASA, ClimateChange.gov), with a total of (4-20 inch)/\(10-50 cm) SLR over past century. Expect (11-38 in)/\(30-100 cm) by 2100 [Smithsonian 2017-01].
Case II – Worst – The worst-case is catastrophic breakaway of the Antarctic ice shelves, and meltdown of Greenland’s glaciers. SLR could be as much as 23ft/\7m ( National Geographic Magazine, 2017-01).
Case III – False – We have nothing to worry about –
« it has not happened »
« it cannot happen » and
« it will not happen » … “because the past is the best predictor of the future.”
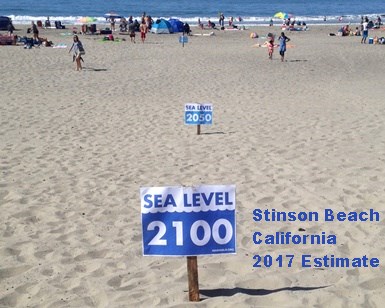
Fig 4 Estimates of future shoreline if SLR is smoothly continuous
Argument against this Case III:
«It has happened in the past» sea levels have been much higher than today.
«The way it works is understandable» The mechanism was understood in the 1970s, modeled in the 1980s.
«It is happening right now» It has been hard just to keep up with the stream of all-time records as this post is being written!
The consequences of sea level rise is a challenge people currently alive today must face. Fig 4 is a local effort to publicize the coming SLR.
The ultimate, multi-trillion dollar question is how high will the GMSL be by 2100?
![]() If we humans do nothing to modify our heating of the environment, the rise might indeed not be smooth but abrupt and chaotic as land supported ice breaks free and floats. In any case, without proactive intervention, every coastal city on the planet will become at least partially abandoned.
If we humans do nothing to modify our heating of the environment, the rise might indeed not be smooth but abrupt and chaotic as land supported ice breaks free and floats. In any case, without proactive intervention, every coastal city on the planet will become at least partially abandoned.
Storm violence ( SV ) is increasing
The ‘standard’ statement – SV events will not become more frequent as the Earth heats up, they will become more severe.
Here, in North America, the U.S. territory Puerto Rico was ravaged by Hurricane Maria in 2017 (Fig 5a, 5b). By Autumn, 2018, a year later, Puerto Rico is still in recovery mode and authorities are still updating the original storm death total.

Fig 5a H. Maria 2017-09 over Puerto Rico and Dominican Republic

Fig 5b H. Maria … no help available from the U.S.
Solar heat is being trapped by the increasing concentration of “greenhouse gases” such as CO2 and is flowing into the ecosystem at the surface. Much of the trapped energy flows into the ocean, and the top layers of water are heating up.
H. Maria did not form in the Caribbean. Hurricanes in the Americas arise as storms in Africa that move westward across the Atlantic. The Atlantic is warming, but not as much as the Caribbean. The storms survive the transit with the aid of Atlantic heat, but can become monsters when they reach the Caribbean. Note that the warm Caribbean does not generate the hurricanes, it just energizes them as they pass overhead.
Along the Atlantic seaboard, H. Katrina (2005, destroyer of New Orleans, the birthplace of jazz) began to fade but roared back to violent life after being re-energized from the waters below.

Fig 6 Super storm H.Sandy moved this roller coaster into the Atlantic
H. Sandy (2012) moved up from the Caribbean for a attack of the Northern U.S. coastal lands.
Fig 6 shows the the New Jersey Star Jet roller coaster after the violent H. Sandy moved the whole thing into the Atlantic. Source: Andrew Burton, Reuters.
All around the world, ocean driven storm violence is similar. No space here to mention all of them.
But hurricanes and typhoons are not the only effect.
The growth in available stored energy also excites changes in the air streams. Here in North America, we have no East-West mountains to constrain arctic circulation and we see winters becoming colder and more violent in some parts while summers grow hotter and their forest fires more violent. Meanwhile, the Arctic ice is thinner/sparcer than ever before with predictions zero Arctic ice within 15 to 25 years.
![]() The SV will grow, fed by the increasing amount of free energy available in the atmosphere
The SV will grow, fed by the increasing amount of free energy available in the atmosphere
So, where is the problem?
Temperature rise is currently the most evident effect of the changing global climate …unless your island home is already under water or if your coastal life has been damaged by storms.
Fig. 7a shows the Earth from NASA’s DSCOVR satellite in June of 2018 (the most cloud-free images for that month were selected).
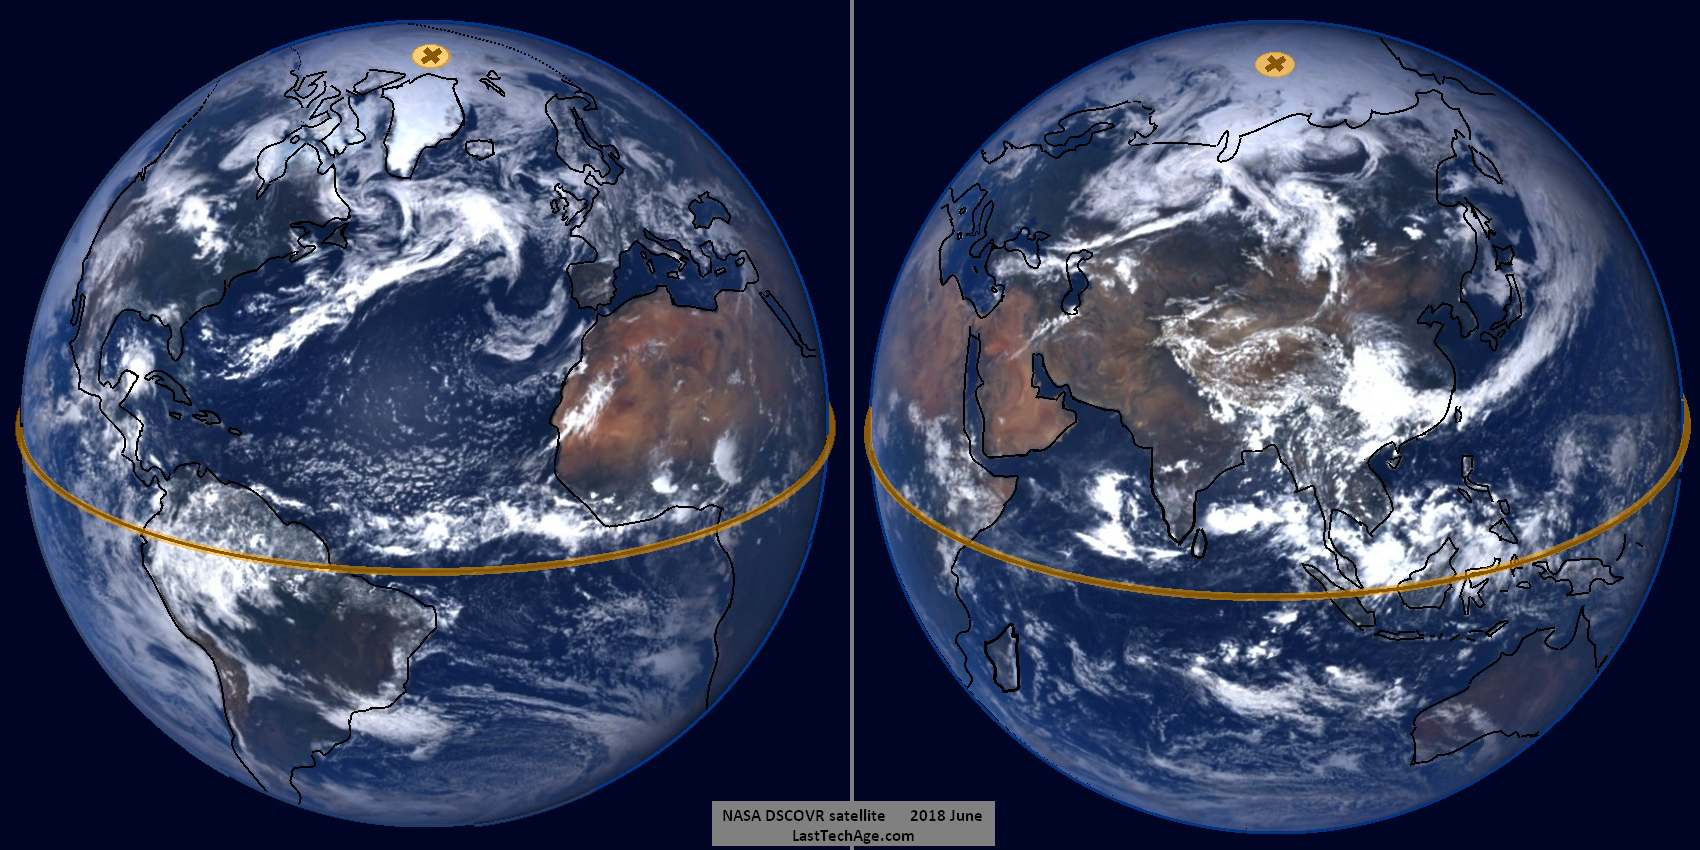
Fig 7a Earth from Space. Left: Atlantic Ocean 2018-Jun-16. Right: Indian Ocean 2018-Jun-01. Source(2018): https://epic.gsfc.nasa.gov/

Fig 7b Most intense solar irradiation is in the the tropics

Comment B The Tropical Belt
Fig 7b shows the tropics, the 40% of Earth’s surface where the sun will be directly overhead at some time during the year. See Comment B.
The tropical zone lies between latitudes 23.43º N (Tropic of Cancer) and 23.43º S (Tropic of Capricorn).The tropics are where the incident solar energy is greatest (highest intensity for the longest time).
If solar heat flux were the main source of our problems this would be the region for the greatest damage from climate shift. Killing temperatures are building up in this region, yes, but it is not where the greatest change for life will occur. Greatest change will be where greatest emission into the atmosphere occurs.
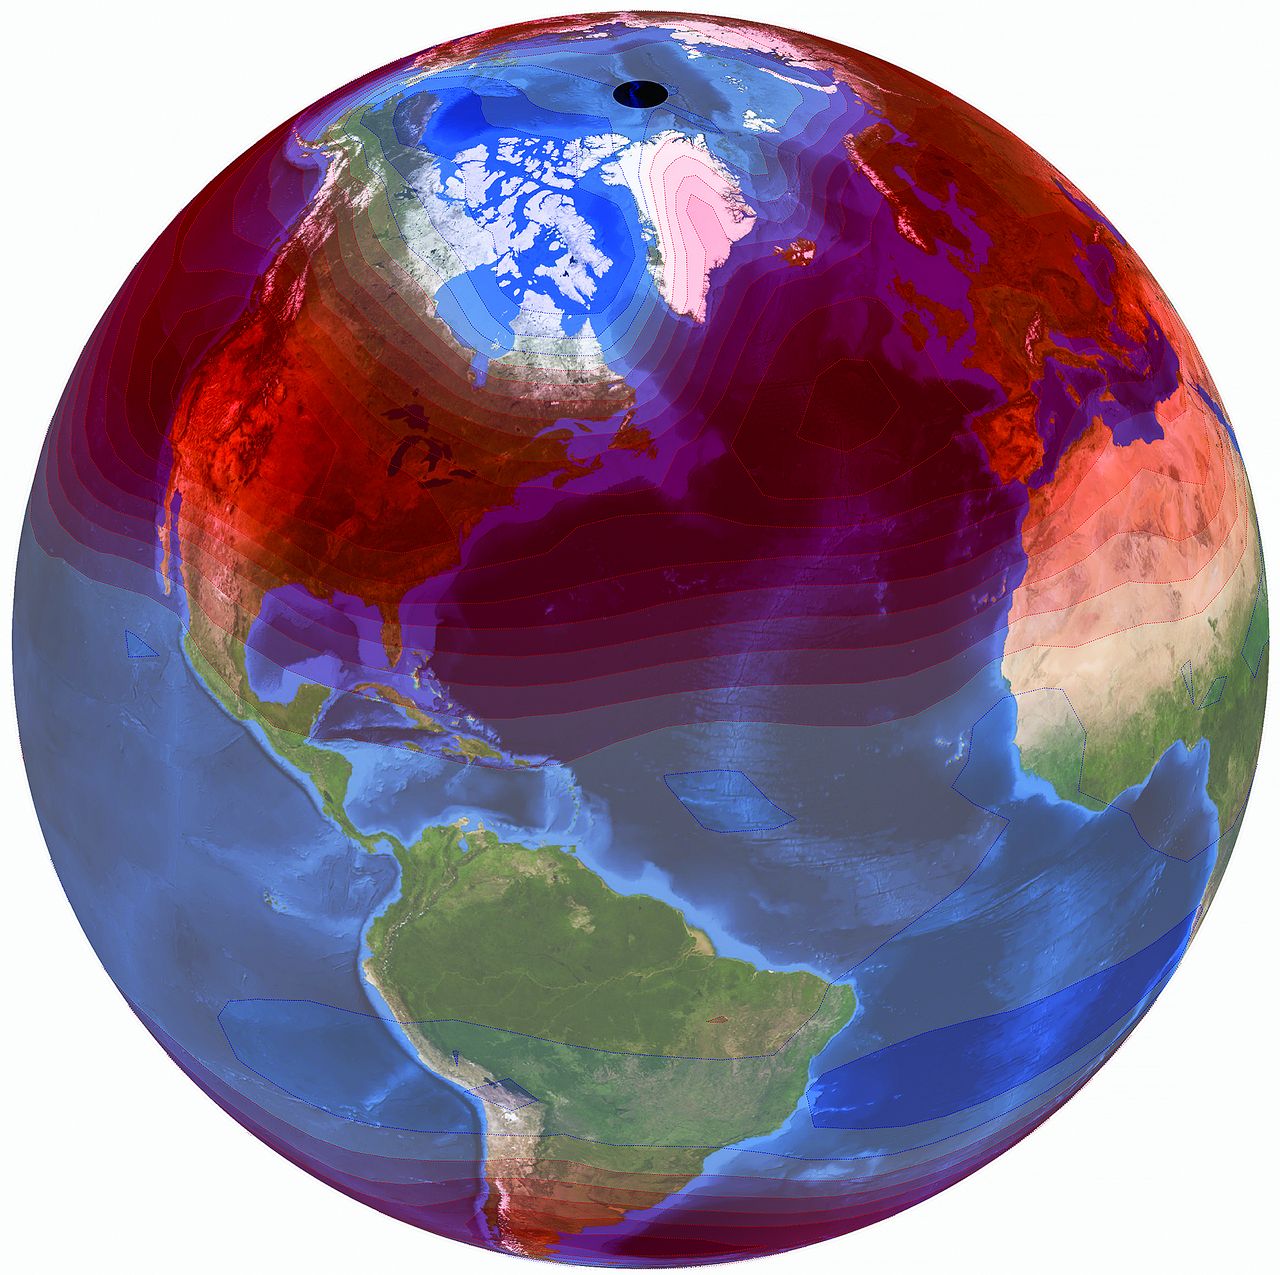
Fig 8 Greatest temperature changes occur in the North and South mid latitudes
A scientific effort, called “attributions”, started the early 2000s as an attempt to use models supported by satellite data to suggest the ‘where’ and ‘why’ for the greatest changes from normal.
New while this was in final preparation
Fig 8, from a Science article by Benjamin Santer et al, shows modeling of data supported by satellite observations.
They showed the the greatest percent change in climate will be in the mid-latitude temperate zones, North and South of the tropics.
If you follow world weather in 2018, you already know that we see records made at the north polar ice sheet, and in northernmost Norway, Finland, and Russia.
What is causing this is obvious – the red zone with greatest climate shift is along the latitudes North and South of the tropics, where industry historically burned coal and oil.

Fig 9 Aussie cattle are fed on purchased corn in this formerly fertile pasture land
In the southern temperate zone, Australia is in the 8th year of massive drought (2011-2018+). Fig 9 shows cattle (in a formerly fertile pasture range) unsustainably fed on purchased corn.
Australia suffered from a terrible drought lasting 9 years (2001-2009). 2 years after it ended, the current problems started…
Too soon, it will again be their turn to set mid summer (Jan or Feb) records.
Added in final editing –
One of the activities behind all this is the emission of the micro particles, called aerosols. For several decades, NASA has used array of satellite monitors to gauge this emission. On 2018-Aug-23. NASA released our Fig 10.
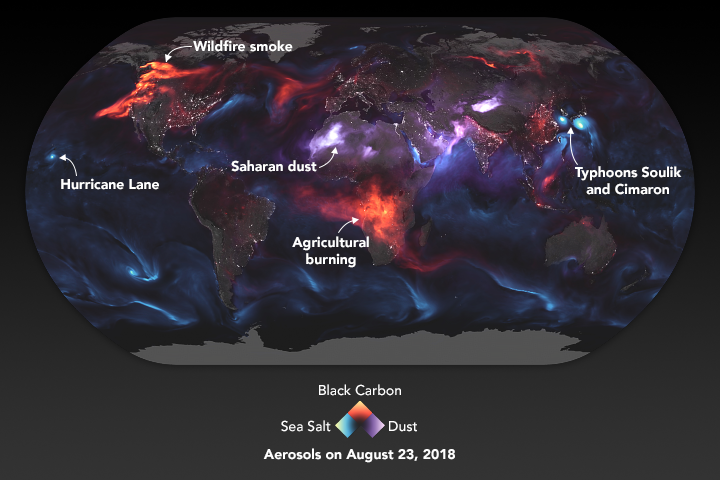
Fig 10 GEOS-FP model of aerosol emission on 2018 Aug 23
Fig 10 shows results from an Earth Observatory (NASA) model that is based on satellite data. It shows the concentration of black carbon, dust, and sea salt in the atmosphere during one day, overlaid on an image of the Earth at night. The displayed color indicates the aerosol type and the brighter the color, the higher the concentration. 5 different features are identified:
- Northwestern coast of North America – Smoke from wildfires
- Southcentral Africa – Smoke from intense agricultural burning
- Northeastern Africa – Dust from Saharan windstorms
- Near Hawaii – Water droplets from Hurricane Lane
- South of Japan and South Korea – Water droplets from typhoons Soulik and Cimaron
These emission data agrees with Fig 8. in that most of the action occurs in the midlatitudes.
Here the basic image at (much) higher resolution. Cities are clearly visible and this helps localize features.
This ends Today’s discussion
We began this discussion mentioning that the gentle trend in temperature rise, sea level rise, and storm violence rise all could be pushed into a chaotic jump if the changes are too fast, or are too sudden.
Our Appendix is a discussion of a paper in the Proceedings of the National Academy of Science (USA) that was published as this post was being finalized. It identifies the 15 or so key influencing effects (such as Greenland’s glacier ice) and discusses the danger of a “tipping cascade” happening because each effect reinforces the others. Any one could trigger any other feature into runaway growth (the cascade).
But, this post is not even close-to-new in identifying results of climate change. For example, Elizabeth Kolbert documented the process in her two stunning books, Field Notes From A Catastrophe (2006) and The Sixth Extinction (2014) which are or should be required reading for every rational citizen, see Fig 11.

Fig 11a Elizabeth Kolbert (2017)
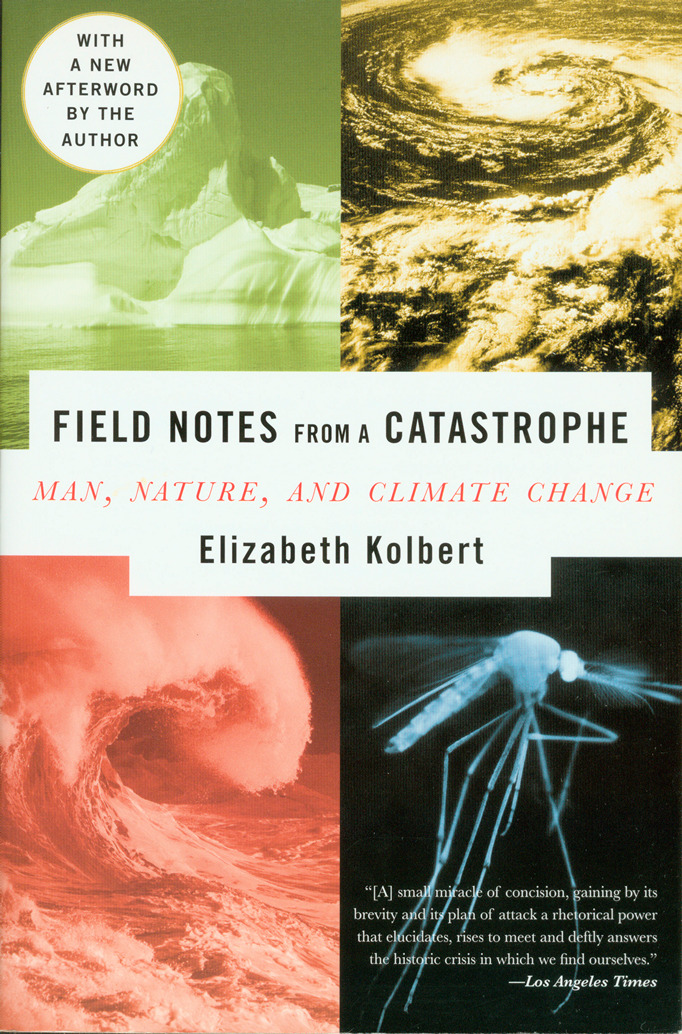
Fig 11b Field notes from catastrophe (2006)

Fig 11c The Sixth Extinction (2014)
Warnings are not new, continued. In 1988, James Hansen testified to congress that climate change was currently happening. He graphed out the near future, but in 2018, it appears he was too optimistic – changes happened faster then those early computer models predicted.

Fig 9 doctored up Einstein
Back then, Talk Radio thought Hansen was hilarious. Modern internet has lots of coercive confusers. Fig 9 is a doctored image of Einstein (1978-1955), from a political troll site.
The pain we have seen to date relating to climate issues is small compared to what is surely coming, Did people cause the issue? Many say no (Climate Shift Denialists). Although we have not discussed to any extent who is responsible, it is clear that it is an anthropogenic issue is . Here is Hansen’s current opinion.
Have we passed the point of No Return? Despite its very large size, you will not find an answer here (LastTechAge). It is possible, though, that after Donald Trump has finished, our course will be well and truly set toward climate catastrophe.
………………………………
Charles J. Armentrout, Ann Arbor
2018 Sep 03
This is listed under Natural Resources > Global Warming
Have a comment? Click on the title of this post, go to bottom, let us know.
Related posts: Click the INDEX button under the Banner picture
Appendix
A report in the Publication of National Academy of Science (PNAS) is a good discussion of the positive feedback modes, “tipping cascades,” for the influences that effect the global mean temperature, the global mean sea level, and the global mean storm violence.
Positive feedback is when the growth of an effect impacts a different feature and causes it to also grow. Positive feedback causes a surge in growth (the cascade), that is, a chaotic jump in equilibrium by a seemingly stable systems. Tipping is an allusion to boating in a canoe. You may safely lean sideways. But if you exceed the tipping point angle, everybody goes splash.
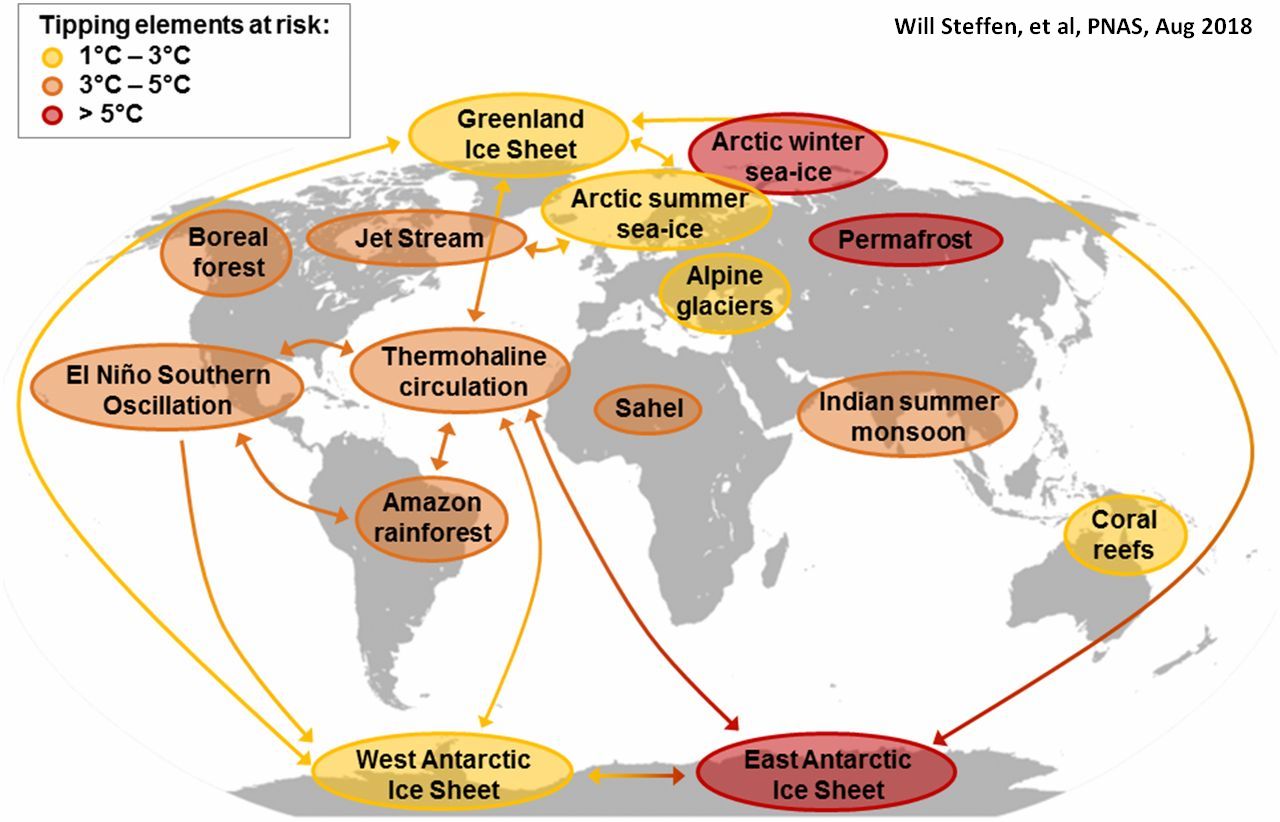
Fig A1 Temperatures that can generate tipping cascade that would generate unconstrained growth.
Fig A1 shows 15 influences that effect the stability of the Earth’s biosphere. Each interacts the all the others, in one way or another. Each is susceptible to a tipping cascade. Of note – The Greenland ice sheet and the West Antarctic Ice Sheet are already in mild feedback mode. If the global mean temperature reaches the labeled values, we (the human species) could experience the “Worst Case” sea level rise and all the related disasters we discussed in our text.
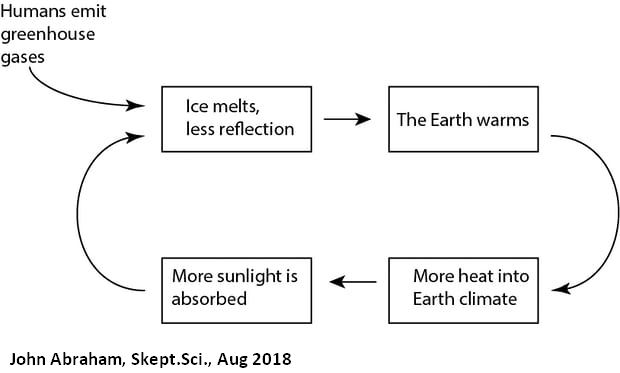
Fig A2 Positive feedback loop between Earth temp and ocean ice can be driven by emissions
John Abraham (SkepticalScience.com) presents this simplified diagram of Fig A2 as aid to explain the tipping cascade. It represent a standard loop that operates throughout the year.
When the loop is driven by the sun, it is the annual weather cycle.
- highly reflective ice melts and reduces the average albedo (reflectivity) of the planet.
- Reduction of ice leads to a warmer surface; the Earth warms.
- The warming transfers heat into the ambient environment (climate). This warming induces the path to return to the original ice melt.
Summers have the lowest ice cover for the region. Then the sun shifts, the Earth cools down, Winter has the most free ice for the region. 〉〉 The injection of greenhouse gases (arrow, upper left) can force the loop into larger changes each step. This loop becomes self actuated after the temperature has risen beyond a threshold value – the tipping cascade.
The PNAS paper reinforces our chaos post that seemingly stable systems have influences that orbit about each other; their interactions can shift the orbit’s average center – potentially without warning.
LastTechAge described chaos jumps as changes in a phase-space orbit. Influence threads are fully independent of each other but are causally interconnected. When you drive on a highway, your North, South, East, and West motions are connected by your steering, even though the directions are independent. Phase-space diagrams are a good visualization aid for complicated things.
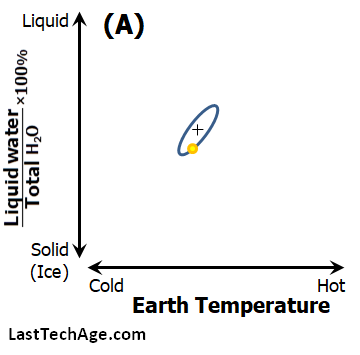
Fig A3-A H2O v T model: Early, with little to no added greenhouse gas. The yellow point of Now in its annual orbit the quasi-static “attractor” point
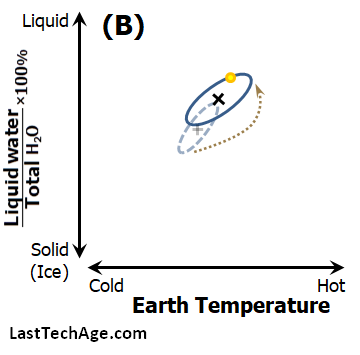
Fig A3-B H2O v T model: Today. Greenhouse gas added, Earlier loop changing into new climate without a chaotic jump. Greenhouse gas increasing in atmosphere
Fig A3-A is a sketch with 2 independent climate influence threads, Earth temperature and total liquid water as a percent of all the H2O on Earth. Vertical runs from 0% to 100%. Neither axis is actually scaled for this sketch. By this figure –
♦ Earth’s temperature annually swings between high temp. and low temp.
♦ The water’s liquid/total ratio which also swings between high % and low %.
♦ It is clear that T and %Liquid are in phase – they are low together and high together.
The yellow circle is the Now point (the instant of people’s awareness) which moves in orbit about the a net mean value (the +) that also moves, but slowly.
Fig A3-B is Fig A3-A after people have released a greenhouse gases. The gases have shifted the orbit slowly, year-by-year from the equilibrium point, the orbit’s attractor [×]. This is similar to Earth’s situation today.

Fig A3-C H2O v T model: New orbit after climate cascade when greenhouse gas concentration passes the tipping point.
Fig A3-C shows the orbit after greenhouse gases have reached the tipping point.
The tipping cascade event generated a runaway heating cycle, resulting in “Hothouse Earth” in the upper right corner. The pale arrow between the two X points is the chaos “jump” from the original quasi stable state to the new one.
The final orbit and its central average would not be clear until a long and painful time had passed and every part of the new condition is in equilibrium with all the others.
The greenhouse gas effect climate would be very clear if this influence thread (gas concentration) were used as a 3rd dimension..
Currently, we plan to update our chaos post to show such a 3 dimensional path in phase-space. This post will updated to announce that change.
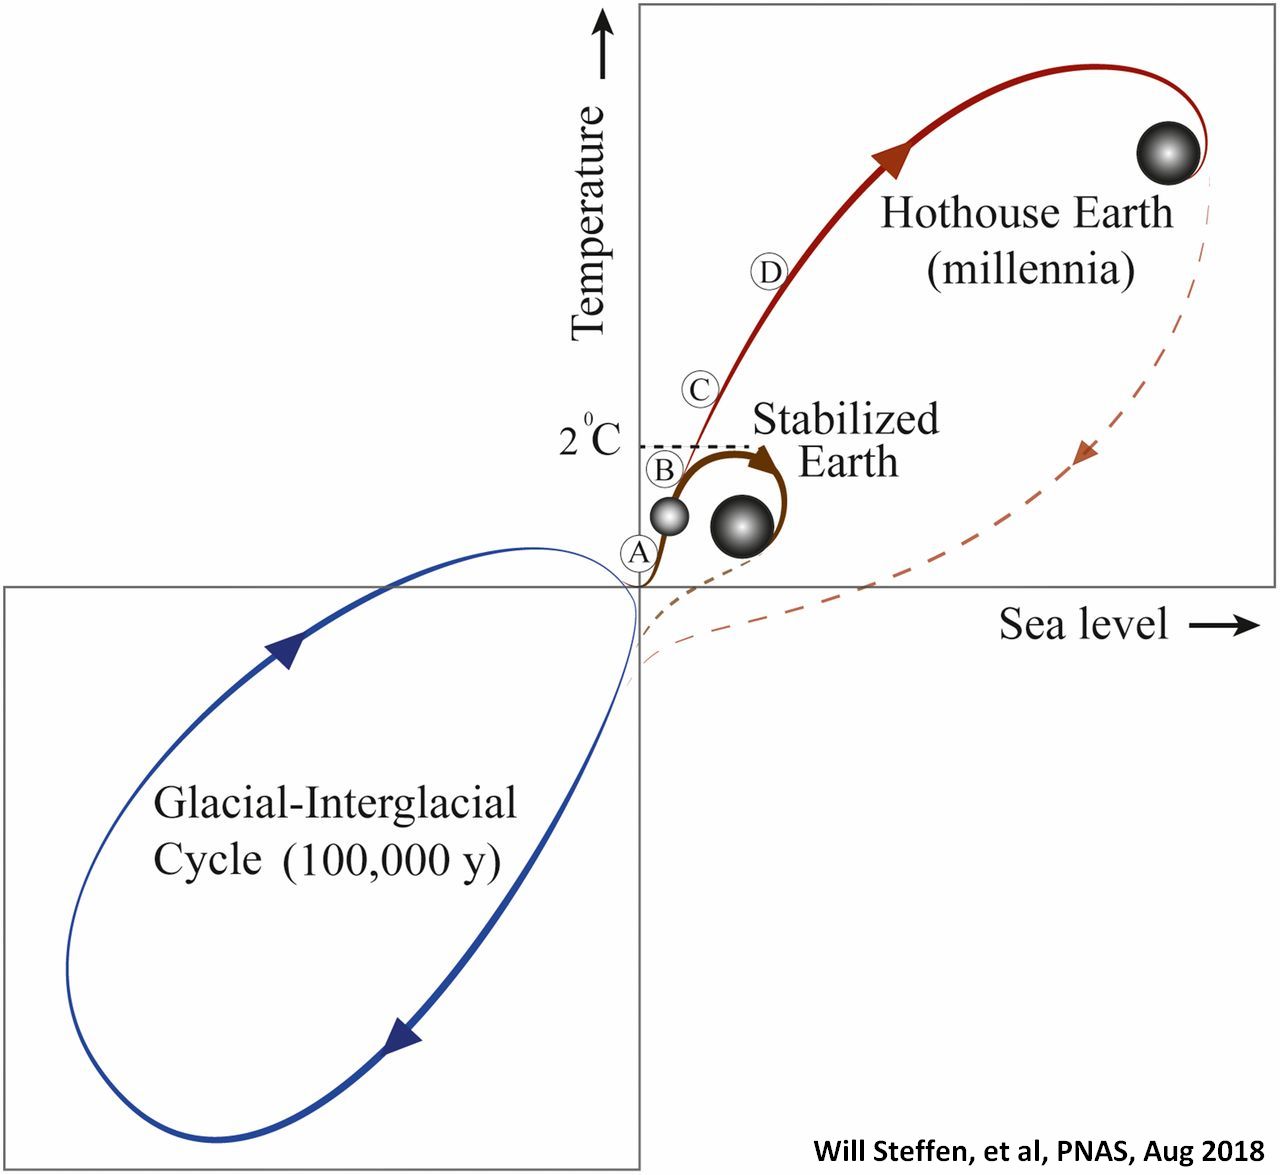
Fig 4 T change vs SLR phase space graph in 2 dimensions, showing a stabilized solution and one that has us doing nothing, with the tipping cascade stabilized after we have ended.
A simple phase-space graph was employed in Steffen, et al (the PNAS report), which we show as Fig A4. They plot temperature change against sea level rise instead of the choice in Fig A3.
They can show the geological 100 k·yr phase-space orbit and the anthropogenic one.
Hothouse Earth is after a chaos jump that kills everything. They show that if we can work extremely hard now, we very well could stabilize the shift and the species could survive. Both cases show hypothetical return to the current T and SLR.

Why is it everyone is ignoring the biggest news story in history which is our nice very much yellow sun you used to see at noon in the 1970’s in now a very intense white. I cannot believe that this dramatic and obvious change in something that is literally right in your face nearly everyday has went unnoticed. People talk of climate change and speak not a word about this it’s insane. I cannot take anyone seriously if they are actually unaware of this most important change that has occurred in all written history. I know that many have to be aware of this change in the suns color but I can only conclude a gag order has been issued and no one is to speak of it. On the web there is but a few hindered individuals who are asking the same question as I and they are getting the same blank stare answers, it’s sad that so many seem to be lacking basic common sense.
LikeLike
“it’s sad that so many seem to be lacking basic common sense”
Hmm. “r. Fleenor” appears to be a troll, but I have approved it anyway. Never the wrong time for a rant! Here are my points:
(A) if the sun had changed its color temperature from a bland yellow to blazing white, astronomers everywhere would have been more than excited. The sudden increase in temperature would have meant the fuel was burning at much higher efficiency and the diameter would have had to grow. Nobel Prize territory, here, guy. No, either world scientists of any and all stripes are “in cahoots” to defraud you during your last few years in a livable Earth *or* the idea is a hoax.
(B) I was a fully empowered adult in the ’70s, in graduate school (plasma physics). I lived in Madison Wisconsin. It was truly cold back then – Winter night temperatures below -20F (-29C). However, during the day, the sun was blazing white; but somewhat low in the sky. It was blazing white in the summer, too. White means all colors in your eyes are saturated. White is the blend of all colors. The sun has always emitted in a broad spectrum of light that peaks around 500 nm (green)… has not changed within history. The air quality has changed a lot, though, which could affect your perception from when you were a very young child to now, when you are a lot older. (think about what filthy air does to color.) LastTeckAge as posts on this, but here is an external link http://solar-center.stanford.edu/SID/activities/GreenSun.html … try to Google this yourself, if you really are interested.
I think, though, that you are actually either in high school or are playing the role of troll. This does not really have the feel of a true query. Sort of like \it “Why do people *still* believe Apollo 11 landed on the Moon?” .
LikeLike