
The Minimum Wage, Poverty Level Wage, and Unemployment Employment rates are part of the complex of forces driving American inequality.
Minimum wage is in the news because in many localities the current $7.25 seems too low. Should there be a uniform minimum wage or a patchwork of rules throughout the country? What seems to be emerging is an increase in the basic allowed minimum value, with local option to raise that minimum for their locality. Why do this? LTA argues that it is relieve advancement blockages that have appeared over the past 30 years.
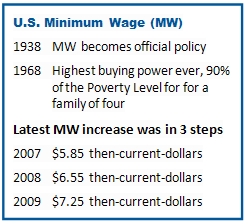
MW – U.S. Minimum Wage
PLW – U.S. Poverty Level Wage

Fig 1: Minimum wage in then-current face value and in inflation-adjusted values
Fig 1 shows the federally mandated MW since the law began. The lower (blue) line with circle markers is the value of the MW.
An interesting discussion of the minimum wage can be found at this Oregon State University website.
The MW in constant buying power is shown in the upper jagged (red) curve with diamond markers. This adjusts the MW dollar amount for inflation, to always be the value in 2012 dollars. At 2012 the two curves join.
 This adjusted curve is really interesting if you pick at it. The purchasing power of the MW jumps when Congress sets new values, then decays as inflation reduces the value.
The current MW was frequently raised between 1938 through the Nixon election of 1968.
Pres Nixon coined the phrase “benign neglect;” evident policy until he abdicated. Ford and Carter kept the PLW pretty constant during a really high inflation period. Reagan – or his advisers – took the benign out of Nixon’s phrase.
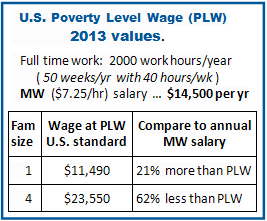 The PLW was defined in the late 1950s as an average across the nation. Its 2012 value is the flat dotted (green) line (top of Fig 1). Click here for current values.
PLW is the income for a worker who supports a family of the size shown in the table. A single person with a full time MW job will make a bit more than the PLW. Although grim, the table understates the situation. A significant number of earners can not get a full time job, only part time MW jobs and earn less than the 2000 full time hours.
But for a family of 4, a full time single worker at MW makes significantly less than the PLW; such a worker was never meant to be the sole income provider for a family of 4. Even so, MW=PLW was almost achieved during Pres Johnson’s years (1963-1968), though the pushback on the massive social changes of the day proved to be too strong.
Nowadays, MW has drifted into the role as the only income for a sizable segment of our population (think single women with children). The discussion on raising it to match the PLW is not unreasonable.
Inequality and the Minimum Wage
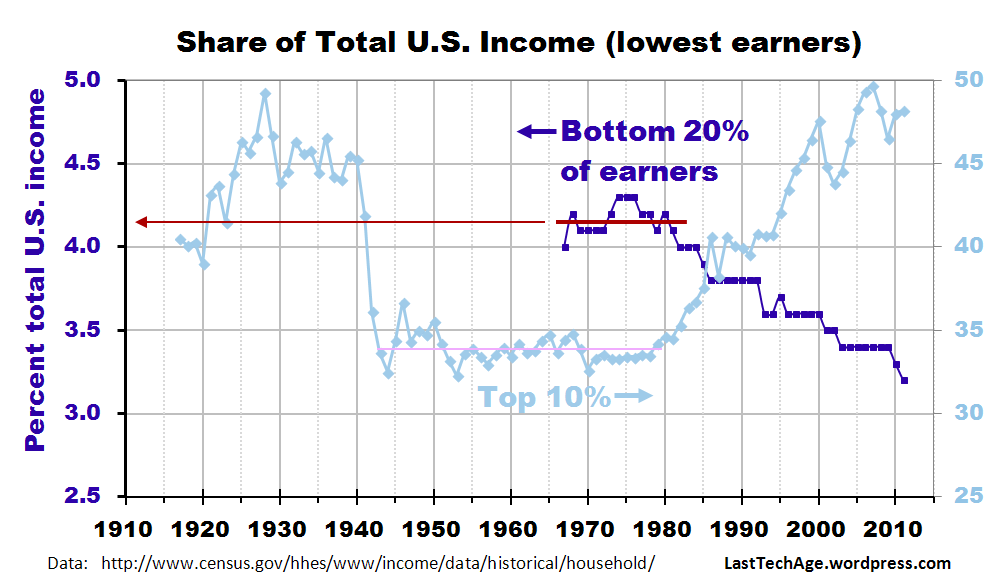
Fig 2: Fraction of US total income Lowest 20% of earners
Fig 2 shows how the bottom of the wage pool has fared against the even smaller top of the pool. Heavy (dark blue) line is Census data (recorded since 1968) on the income share of bottom 20% households in US shows systematic decline since 1981
The background income graph (light blue) is from Atkinson, Piketty and Saez as discussed in the wage-pool link. The solid A-P-S research on old tax data started the current atmosphere of concern over inequality.
Several attitudes underlie the broad discussion-argumentation over the minimum wage.
- The MW problem is an issue of our current time. It would have no other meaning than what it means in the 21st century’s teens-decade. We are at the bottom of an inevitable economic cycle. Good jobs will be back after our full recovery. (Simplification of a comment from a Cato Institute spin-meister.)
- The MW is an out of date hold-over from the 20th century, part of the archaic historic record. The people on the bottom do not have what it takes for success, should be left alone to pull themselves up. The bottom 20% should take sub-minimum wage jobs, work well, get promoted up the income chain. (Neo-libertarian view, in the manner of Paul Ryan, Mitt Romney, Charles and David Koch.)
- The MW is a vital part of survival because Figs 1 and 2 are closely linked. The drop in low income wage share is inexorably entwined in the documented rise of self-righteous American aristocracy. Support structures, such as a mandated minimum wage, are under attack. The working poor cannot feed their children well, nor offer enrichment experiences. But these children must compete with children of inherited wealth. Economic success has been clawed out of the grasp of the lowest earners.
The data speak for the third point. “What it takes” to succeed today is insider contacts, special recommendations and the trust that allows success even when inevitable problems occur. Go to the right schools to meet the right clique in your age cohort. You use your personal network to acquire a good position, though choice of parents is important. Who would Mitt be if George had not been truly successful as a business creator? Why would Charles and David matter if Fred C. had not made his fortune?
Employment vs Unemployment
News this month is that finally (!) we are seeing true recovery from our 2008 economic excursion. Unemployment has followed a steady drop and reached 7% last month.
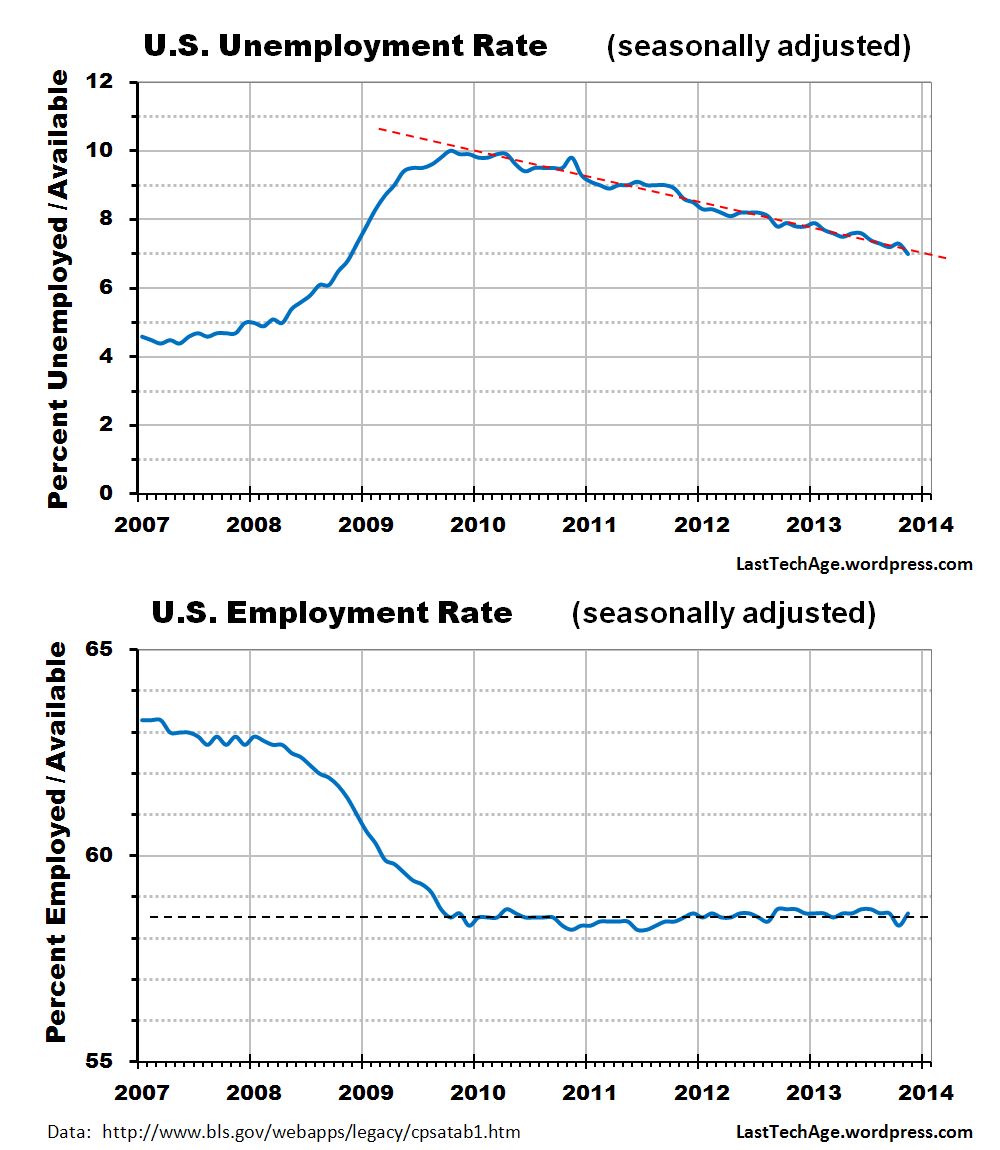
Fig 3: Unemployment and Employment rates 2007-2013
Great! A return to 20th Century normalcy! But, let’s look under the carpet before dancing in the streets.
Click on Fig 3 to see a larger image. Certain commentators say that the unemployment rate might be deceptive. We tweeted a link to a site that showed charts with Bureau of Labor Statistics data; fig 3 present our graphs, probably the same data. BLS has seasonally adjusted its tables to smooth early winter drops; we added lines to both graphs to help focus on the trends.
The top curve is positive. This nation-wide average shows that the percentage of people looking for a job has followed a steady (linear) decline since late 2009, from about 10% to the announced 7% for last month.
The bottom curve is shocking. The number of people currently employed has been a nearly constant 58.5% since it reached bottom in 2009. If the number of unemployed has dropped 3 percentage points, why did it not show up in the Employment rate? Unless the NSA is disappearing our unemployed, these people (who could work and wanted to work) have dropped out – fallen below the BLS radar. Discouraged, disillusioned?
Picture this – put yourself as the student in one of my classes – one of those who told me that, at 28, he was back living with Mother and Dad, and entering college. He has not been able to find a work position for 4 years. Are Bill Clinton and Barack Obama right, will he find a great job at the end? But employment is not rising, and I truly fear that many are trapped. The longer they lack employment, the less likely they are to find a job without insider contact. Media likes to classify generations – GenX, Millenials, etc. Is this to be the Lost and the Discarded generation?
Conclusions
Congress and talking heads are arguing about what to do with the minimum wage, unemployment benefits, and other social support programs. The undeniable trend of wealth-grabbing by the elite aristocrats (Fig 2) are correlated to the decline in the ability for those at the bottom to work their way upwards to economic success. There are many more facets to this inequality issue – it is a complex of co-interacting forces that affect each other and drag our system downwards.
Here is one emerging image for a conclusion to our generations-long change in access to jobs and adequate incomes, coupled to increasing expenses due to inexorably increasing resource costs
- Our lowest economic quintile lose access to what have been basic amenities of American life, and the opportunity to swim toward to top of our economic pool. They and their children are trapped in poverty.
- Our ultra rich top 0.01% continue accumulating additional income share and live in gated – and guarded – communities with access to their deserved amenities – insider contacts, the newest electronic tools and toys, lifesaving medical procedures, to name a few. Reminds me of a bad movie, like Zardoz but without Sean Connery.
Maybe such an image will not become reality. Local ordinances are being studied to raise the MW to the PLW level, even higher. This is a start. Then we must bring manufacturing back to the homeland to secure good full time jobs for everyone. Then rationalize our international trade procedures. Then re-establish tax codes to keep the fraction of the income pool constant for each economic segment. Then …
……………………………….
Charles J. Armentrout, Ann Arbor
2013 Dec 19
Listed under Economics thread Economics > Inequality
Have a comment? Click on the title of this post, go to bottom, let us know.
Related posts: Click the INDEX button under the Banner picture
