
FiveThirtyEight posted on the decline of startups. Who would have thought of Saez-Piketty inequality?
New information shows that startup businesses in the U.S. have been following a declining trend since 1977. This was posted by Ben Casselman, chief economics writer at Nate Silver’s well known FiveThirtyEight.com blog.

Fig 1 Ben Casselman
Casselman presents several graphs – The charts show that the startup fraction of all existing enterprises has been decreasing for decades. Established businesses had little to fear from disruptive new techniques traditionally brought to maturity by newly started business wanta-bes – at least in America.
He points out “Entrepreneurship is a critical source of jobs in the economy. Perhaps even more importantly, it is a major driver of productivity growth.” This growth is fueled by new ideas and techniques championed by the entrepreneurs who want to do new things.
New businesses have always had a high rate of failure. Many startups naturally fail; the ideas do not catch customer attention, their techniques do not scale to large production and are infeasible, or the business efforts are not well enough funded for success.
Casselman’s post is stunning – the trend is that each and every year “fewer Americans are launching businesses.” And still fewer become successful. Casselman uses a Brooking Institute report by Ian Hathaway and Robert Litan and reports that the only segment that has not seen an increase of failures is composed of businesses operating for more than 15 years. Click on the FiveThirtyEight link above and read what Casselman actually said.
The Brookings report makes interesting reading, too – sort of like sitting on the Titanic’s deck and measuring how much dry deck space remains as a function of time. LTA decided to get up from our deck chair and look at the effect from other angles. If our feet are going to get wet, might as well keep our minds occupied on cool trends.
So– the fraction of newly formed businesses has dropped every year for decades. How many years has this been going on? Does it have any relation to the sudden rise in inequality shown by Emmanuel Saez’ 2009 data? We have started calling this the Saez-Piketty Inequality because Piketty’s book put inequality data into economic perspective. (See this post, figures 5 and 6).
Everything changed for Saez-Piketty trends at a key time around 1981. Could business startup history be related? Do startups show a key time too?
Fig. 2 plots startup data and Inequality data on the same graph.
- The red foreground line is the Brookings/Casselman business startup data.
 The light blue line is Saez-Piketty data for a top fraction of American income earners. The key time was 1981 when when fractions of total income left its post WW-II stable trendline and suddenly started to trickle-up from the low earners into the pockets of the high earners. The top 1% of all earners amassed ever larger fractions of the income pool, the lower earners had to accept ever reducing shares for themselves.

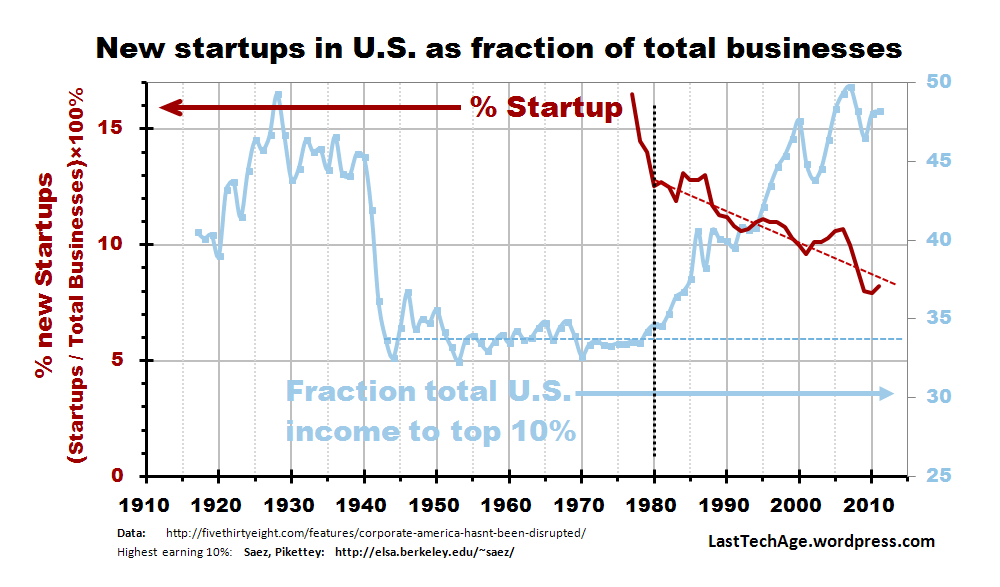
Fig 2 Fraction of new startups in red, with Saez-Piketty top 10% earns in light blue.
The dotted lines are to draw attention to data trends – the Saez-Piketty Inequality curve has a flat trendline between 1945-1980 and a rising trendline, thereafter; business startup curve displays a straight descending trendline after 1980. The black vertical dotted line at 1980-81 shows the key time, shared by both.
Startup data begins with a steep descent between 1977 and 1980. This interval must have been short, no more than 10 years, because the economy was full, and startups could not have constituted more than 1 out of 5 businesses – hard to believe they exceeded 20% since WW-II. But, without more data, at least to 1950, your conjectures on this is as good as mine. Mine is that the steep initial fall was due to the post-Vietnam “stagflation,” shock of the petroleum embargo, and attack on our embassy in Iran with the brutal capture of diplomatic hostages.
The data sets have negative correlation after 1980. Post-1980, one trendline (S-P inequality) rose linearly, while the other (startup) fell linearly– this means the data sets have negative correlation (i.e. are anti-correlated) …are moving in the opposite directions.
Really interesting – No sudden drops in the startup fraction when the recessions of 1987 and 2000 happened, whereas our ultras‘ earning fractions do show sudden drops (with rapid recoveries). Naive guess: are not entry level businesses most vulnerable to collapse during sudden onset of deep recession? No.
Personal comment on Fig 2. Americans today are no less innovative risk takers than their forebearers. What has been changing is the chilling of the climate to welcome new blood into the circles of influence and power. For example, it is absolutely required that adequate finances exist to bridge the startup period, but the requirements of modern venture capitalists have morphed into risk-adverse, homerun-seeking demands.
Can other data sets be compared to Saez-Piketty Inequality? The LastTechAge was started when we made the correlation of our personal fusion physics experience and Emmanuel Saez’ 2009 data. Here is what we originally used for the data set in (A) —
- Fusion physics had low support until its understanding matured. Then the American Fusion Engineering Act of 1980 released funding to build a prototype fusion power generating plant. 1981 became the fusion energy key time when funding was slashed and began its long drop into strangulation.
See this post, figures 5 and 6 for the fusion correlation.
Many of seemingly unrelated trends can replace the data set of (A). Comparison data should be “normalized” so that every point indicates the same thing.
- Saez looked at subgroups of the constant total of the 100% who earn money, and calculated the fraction of earnings for each subgroup. That way, ups and downs of the total economy would cause only secondary effects.
- College tuition data were inflation-adjusted so that $100 had the same purchasing power throughout the timeline.
- Brookings Institute startup data is divided by the total number of enterprises during that year, so shrinkage or growth of businesses would be a secondary effect.
Casselman presents several graphs – The charts show that the startup fraction of all existing enterprises has been decreasing for decades. Established businesses had little to fear from disruptive new techniques traditionally brought to maturity by newly started business wanta-bes – at least in America. I look forward to finding more such normalized data sets, before our ship has truly sunk.
Casselman presents several graphs – The charts show that the startup fraction of all existing enterprises has been decreasing for decades. Established businesses had little to fear from disruptive new techniques traditionally brought to maturity by newly started business wanta-bes – at least in America.
The current set of S-P correlations we have discovered is in the file “Trends correlating with Saez Piketty Inequality.pdf” Click the button [PDF References] under the banner; it is filed under Economy.
……………………………….
Charles J. Armentrout, Ann Arbor
2014 Aug 11
Listed under Economics … thread Economics > Inequality
Have a comment? Click on the title of this post, go to bottom, let us know.
Related posts: Click the INDEX button under the Banner picture

I understand the point; I just wonder if people are being counted properly. For example, I have been studying the self-publishing field for the past three years (preparatory to engaging in SP myself). Millions of writers (lit.) are becoming little businesses that publish one (themselves) or a small group of writers on venues such as Amazon.
A recent post at The Passive Voice (http://www.thepassivevoice.com/08/2014/indie-authors-quitting-their-day-jobs-redux/), a well-regarded site frequented by self-publishers, asked indie authors whether they are making money at it, and the response to this post and its predecessor has been massive: many people are making enough money to pay their mortgages as other bills. Are these ‘small businesses’ being counted? The NYT and other papers pretend they don’t exist; if you don’t think something exists, you don’t count it. The traditional ISBN from Bowker (an expensive identifier for each book, e- or print, which is used to ‘count books’) is often eschewed by self-published authors in favor of a number assigned by, say, Amazon. So these books don’t get counted.
There are a lot of freelancers operating in the spaces in the internets – communicating with each other without being part of a formal economy – artists, photographers, musicians, and writers. People who do cover design or interior formatting for the indie writers. I wonder if they’re all being counted – and you can’t get more entrepreneurial than them. People who ‘do’ social media for others. Bloggers with tip jars.
Just wondering.
LikeLike
AND other bills, not as.
LikeLike