
Claims that college tuition rate rises cause problems are wrong. Or are they?
Do rising college costs exclude some and force others into crippling loans that weaken their future? Maybe that’s nonsense! Maybe the exact opposite is true – aren’t trends showing lowering in actual payments, making higher education easier for all? Maybe this means graduates have a better future than ever before. LastTechAge uses tuition values from the colleges and accepts the first view. Some folks argue for the Maybes.

Fig 1 David Leonhardt, New York Times
David Leonhardt in his New York Times Upshot column (Tuesday 29 July 2014) gives a strong pushback. Mr. Leonhardt is one of the NYT’s outstanding reporters and is managing editor of the Upshot website. Leonhardt’s comments are probing and edgy, perhaps a bit more sympathetic toward the monied Right.
LastTechAge posted Government data showing that, for the decade prior to 1980s, college tuition followed inflation, then abruptly started rising, following the Saez-Piketty inequality curve. This is a clear and visible data trend, but, if wrong, we should acknowledge it.
As always, click any figure to get a full resolution image.
The data
Here are Leonhardt’s two basic charts..

Fig 3 Change in average tuition paid (CollegeBoard)

Fig 2 Published tuition rates (Bureau Labor Statistics)
Fig 2 shows data published by the U.S. Bureau Labor Statistics, Fig 3 shows tuition+fees data from CollegeBoard dot org (people behind the SAT tests)
The data are plotted as percentages of the starting value, between 1992 and 2012. Question: were the dollar amounts expressed in then-current dollars or in CPI (inflation) adjusted constant-value dollars? Our tuition data were expressed as constant dollars. These graphs are hard to interpret – two curves are red, one gray. This must be why Leonhardt made it an animated graphic, so one can separate the lines – at the cost of understanding the values. (In fairness, the pause button does help a little.)
The point seems to be that the “Government” estimates use the costs that the institutions published. The College Board corrections remove scholarship and grant reductions to show entwining “actual” trends. Leonhardt indicates that massive tuition increases are really so much hyperventilation.
Fig 4 is from our Tuition Addition post. It represents student debt also compiled by CollegeBoard.org! Really different message from Figs 2 and 3.

Fig 4 Outstanding Student Debt, Borrowers, and Average Balance
Fig 5 is from a presentation by an official from the Federal Reserve Bank – New York to the Postsecondary National Policy Institute – PNPI, 2013 Aug 14 (at the link-site, select option 5).
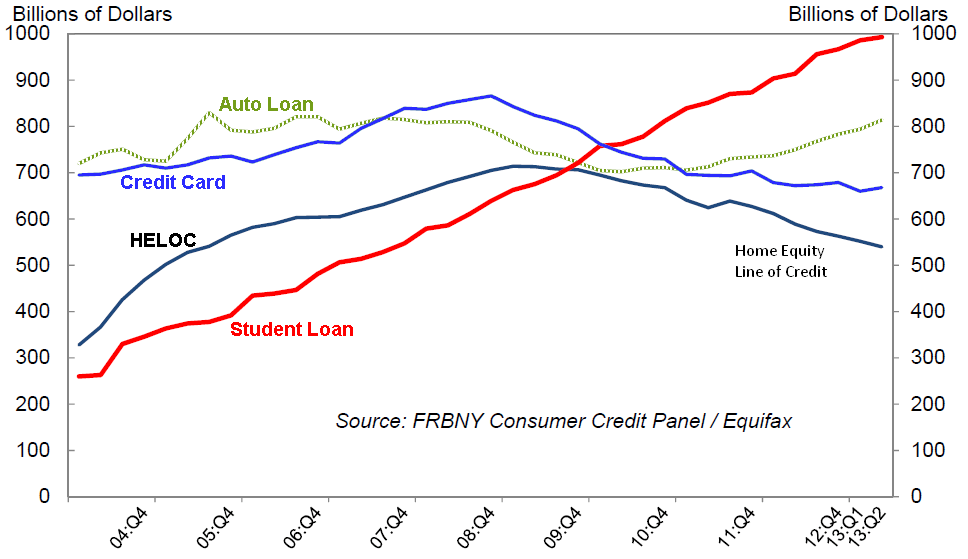
Fig 5 Indebtedness. Source: Federal Reserve Bank–New York
This allows comparisons between 4 different sources of indebtedness (HELOC is debt from home loans). As the FRB spokesperson pointed out, Student Loan is the only category that maintained its quarter-to-quarter growth even during the severe recession.
Tuition trends – an issue or a political diversion?
Note that in Fig 5, the Student Loan curve is well approximated by a straight line — none of the wild gyrations seen in Fig 3. College tuition makes a difference through in debt load it induces. So let’s look a bit deeper, question the assumptions used, maybe the sources of the Leonhardt data.
 This end-of-July column follows an end-of-June column “The Reality of Student Debt Is Different From the Clichés.” Leonhardt relied on this previous post as a fulcrum to shift our assumptions
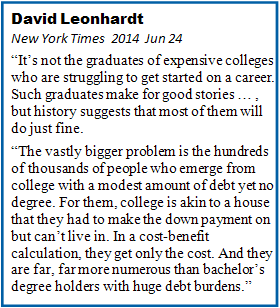
June 2014 Column Leonhardt’s June column relies on results by two analysts from the Brookings Institute, who say
“We do think that the data undermine the prevailing sky-is-falling-type narrative around student debt.”
Leonhardt shifts assumptions, twists our attention from the ever-growing debt load to the fact that many people start working toward a college degree but never finish. This is a topic that spins completely away from the current discussion (will getting a higher degree cause paralyzing debt?)
The spin is part of a different issue – What happened to U.S. higher education? To be discussed in a later post…
Sources? The Brookings Institute was formed 100 years ago, before “Left” and “Right” morphed into today’s ideological twistings. It built a good reputation for quality analysis. Using today’s reckonings, Brookings was center or left-of-center through the 1970s. Its mix changed after far right think tanks were formed (Heritage, Cato, etc.) to pitch their plutocratic/aristocratic views. Nowadays, the Brookings Institute appears to have done a sort of compromise, employing both left and far-right analysts – Richard Reeves is listed with them but so is Scott Winship. So– no judgment here on the politics behind these columns. … Just– the data are at least misleading.
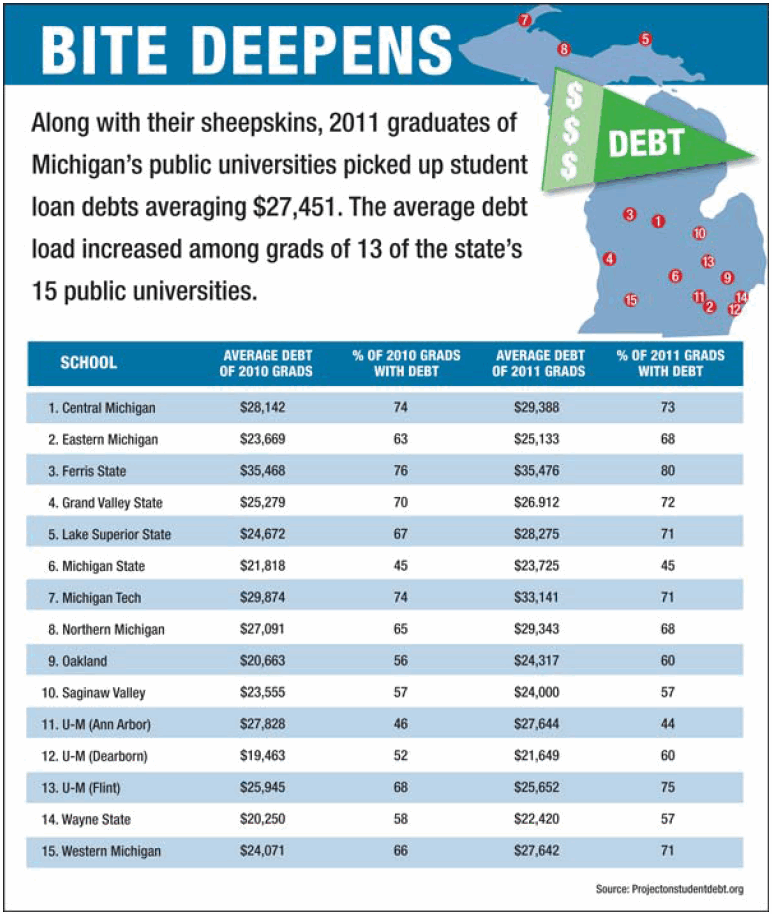
Fig 7 Bridge Magazine 2013 report on local student debt
Checking Locally
Leonhardt indicates an issue with focusing on student debt; I decided to worry globally but check locally.
Fig 7 is a survey from a centrist Michigan news blog. You can click for full resolution, but the lede says it all –
between 2010 and 2011, students in 13 out of our 15 [Michigan] public universities graduated with higher debt.
Ann Arbor is the home for the University of Michigan (UM). The UM pays top administrators and professors salaries that put them into the top 1% of the American earners. Its commitment to undergraduate education is shown by the number of lecture and recitation classes lead by the Full Profs. The UM is a good example of a state-supported high-ranked public university; in all ways, it is the very model of a modern major institution.
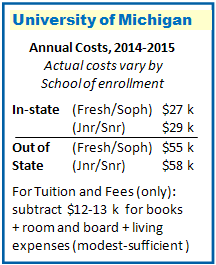
Fig 8 Example– higher education costs
UM website: Costs for Academic Year 2014-15
in-state tuition+fees averages about $13½ k for lower division courses and $15½ k for upper divisional classes. Fig 8 indicates this in its table, but unless can commute, you had better budget for the values shown.
U.S. median household income is barely twice the annual fee, meaning that full price admission is out of the question for the lower 80% of all our families (assuming “reasonable debt” means 30% of total income) should not take on this kind of burden.
At the same site, they explain that financial aid is composed of UM Gifts and Pell Grants. They also assume a modest work-study income to cover living expenses. As the state of Michigan reduces support to the UM, increasing fractions if what does come is shifted to campus infrastructure. Certainly since the downturn in 2008, scholarship resources are stressed and the potential support depends on total household income. For example, households with less than $23,000 have a chance at full cost, no debt education. With increasing family income, the required loans also increase, though some gift money is available for incomes up to $110,000 (upper part of the 5th quintile in earnings).
But not everyone can qualify for support. Since the number of applicants is limited, awards usually go to students with straight A averages from “good” high schools. When accepted to the UM, a lucky student with lower average must budget for most of the costs. By state constitution, the UM exists to educate all qualified state students; increasingly, it is where rich scions to meet and network together.
Published tuition rates ARE meaningful
Based on data from the Federal Reserve Board, Brookings Institute and local experience, we see higher education debt following published tuition rates, not complicated analyses.
We all have reason to be alarmed for our children.
- We continue outsourcing every job that can be shipped out
- The importance of a degree continues growing as the entree to a good job
- Higher education continues pricing itself above reach of an increasing majority of the population.
……………………………….
Charles J. Armentrout, Ann Arbor
2014 Aug 9
Listed under Education
Have a comment? Click on the title of this post, go to bottom, let us know.
Related posts: Click the INDEX button under the Banner picture

Tell me about it! Our youngest is supposed to finish this year – and I can’t wait to stop paying tuition. We told the kids this is their inheritance – but DH is retired now, and it’s going to be a slog to get the last nestling launched. But worth it – judging by the jobs the other two have gotten with their STEM degrees from good schools.
I told them we plan to live a long time and use every penny up – and they’ve all said they will take care of us (I think). It’s too bad we weren’t able to give them a huge start in life – but this means that everything they’ve done since they finished college will be their responsibility, and their achievement. So far, so good. Fingers crossed for just one more.
LikeLike