
Piketty describes the growth of U.S. and World inequality with unique large data resource. Our review of Capital In The 21st Century
The French economist Thomas Piketty published the French edition of his new book Capital In The Twenty-First Century in 2013. (Call it C21.) English version came out in April 2014. Finally.
Click any image for full resolution. Click here to jump to our (LastTechAge) review.

Fig 1: the book causing all the fuss.
Fig 1 is a link to the Harvard University Press website. Review copies were passed around after Christmas and breathless reports started appearing by February.
Response was immediate and strong long before the planned release date and I can almost see/hear rioting mobs outside Harvard offices… Mobs probably never happened, but by the end of March, the publisher agreed to early release its English translation of C21.
My own impatience pushed me over the top in mid-March when The American Prospect ran its critique. I pushed until I received one of the first copies in our area from a local bookstore. So I was ready by the time Krugman and Brooks had face-to-face comments in the New York Times issue of April 25.

Fig 2: Thomas Piketty (2014)
First Things First.
Americans tend to pronounce Piketty’s name as either PICK-etty, a la Paul Krugman, or pe-KET-y, a la moi.
Oh – no no no No!
Dr. Piketty is a native Frenchman. As Krugman wrote, “who knew it should be PEE-ket-EE?”
Personal name? A guess: probably “toe-MAS”
The buzz
This book made inequality the word de jour from mid-winter to early-summer. The hype started prior to his April tour in the U.S; those pre-release descriptions generated standing room only for nearly every appearance. Stunning – probably the most stunned was the serious scholar, Thomas Piketty. As most people know, C21 hit the top of Best Seller lists (!) and stayed there. Copies evaporated from booksellers’ shelves. Harvard University Press reports the highest sales for any new book in its century of business … this for the hardcopy edition of a scholarly tome!
My best guess – most people are not reading it for any detail. If you can get it, read at least the introduction. It has good, interesting background and and lays out the ideas underlying economic inequality.
At its end, C21 presents a discussion of how to avoid the successful diversion of the world’s wealth into the hands of an ultra tiny, ultra powerful and ultra rich group
Why C21 is important – Review
C21 provides inferences from data on wealth, income and inequality available nowhere else. It is a data-driven discussion on the diversion of capital and income into the wealthiest segment of our population.
Piketty wrote C21, but he is part of a large cooperative team assembling the WTID (World’s Top Income Database) available to all here. This is the world’s largest database on trends in income flowing to the different earning sections of populations world-wide. He has announced that WTID will be transformed into the much more inclusive WWID (World Wealth and Income Database). These workers are special – Thomas Piketty in France, Emmanuel Saez in the U.S., Anthony Atkinson in the U.K. and all the others. The effort provides unrestricted access to information not otherwise obtainable, anywhere.
Piketty contributed French data extending back to the late 1700s. Atkinson did the same for England using data from the 19th and 20th centuries. Saez got hold of U.S. tax records from 1913 and forward. Saez’ work caught my attention in 2009 and, to a very important extent, LastTechAge started in 2011 due to those data (see our Zero Sum Games). I shifted from an experience-based belief that for most of my productive life, our technical competence eroded, to a data-based understanding as to why.
What Capital In The 21st Century Says
C21 is a detailed book for non-economists written by a scholarly author; it runs to 577 pages, not counting pages of notes and good index.
The issue of the journal Science, May 25, 2014, published an overview by Pikettey and Saez that is 5½ pages long. It is one of the articles in its 50 page Special Issue on the science of inequality. Although it is aimed at a slightly more technical professional audience, I think it is a really good introduction to C21.
The WTID group works with historic raw data, such as tax returns, and generates many charts. It does not use the differential equation modeling typical of many economists. The team makes adjustments on the raw data using assumptions that are clearly stated, so that the results are consistent with each other. Results are placed in Excel files.
Pikettty, Seaz, and team draw their inferences from those data, not from ideologically “reasonable” models.
The U.S. trendings
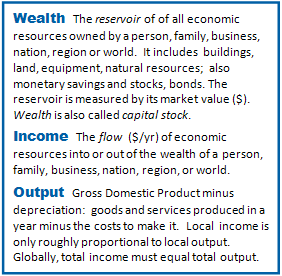
Cmt-A Definition of Wealth, Income, Output
Cmt-A is my non-economist descriptions of important concepts, though the Output local/global comment is per the book. Don’t blame Dr.P – all errors are mine.
Note: Piketty uses wealth and capital interchangeably and explains his reasons in the book.
I am focused on income inequality trends, but C21 actually shows global trends on income and wealth, industrial production and growth. Our comments here will stay with what has been going wrong in America.
Fig 3 shows Piketty during a presentation. Fig 4 shows the same data from the WTID independently plotted .

Fig 4: LTA graph of same data base 1917-2011

Fig 3: Piketty presenting iconic top-earning 10% of population graph
C21 has a fruitful way to look at the data. There is always a fixed 100% of all income flowing through the economy. Divide the the total group of earners into various sub-groups, from the lowest paid earners to the highest. Then, determine what fraction of that 100% total flow goes into each sub-group. You have to work at it though – the two percentages are easy to confuse and many commentators are diverted by the changing total dollars in motion.
Informed inferences are there for the making; but you must be willing to correlate WTID results with 100 years of U.S. history.
Post WW-1, the highest-paid 10% raked in ever larger fractions of the money moving through the economy. For example, one can see the ’29 crash, the quick resurgence of wealth percentage, and its growth stopping at 45% total flow by the 1935 progressive tax law. Real equilibrium emerged about 1945 when WW-2 ended.
The equilibrium share of income for the top-compensated 10% was 34% of income (with small fluctuations). C21 uses the French phrase Trente Glorieuses (“30 glorious” years) for the equilibrium decades between 1945 and about 1980 or 81.
Reagan’s Economic Recovery act on 1981 was an undo for Roosevelt’s progressive tax and you can see the sudden % shift upwards as ever-greater income flow was diverted to our fine & deserving Toffs. This means that the rest of us had to accept ever-decreasing fractions.
WTID provide historical data to use for comparisons. Other data sets may be fruitfully compared to Piketty’s database charts, and the LastTechAge has frequently used them for correlative support. Here are some examples …
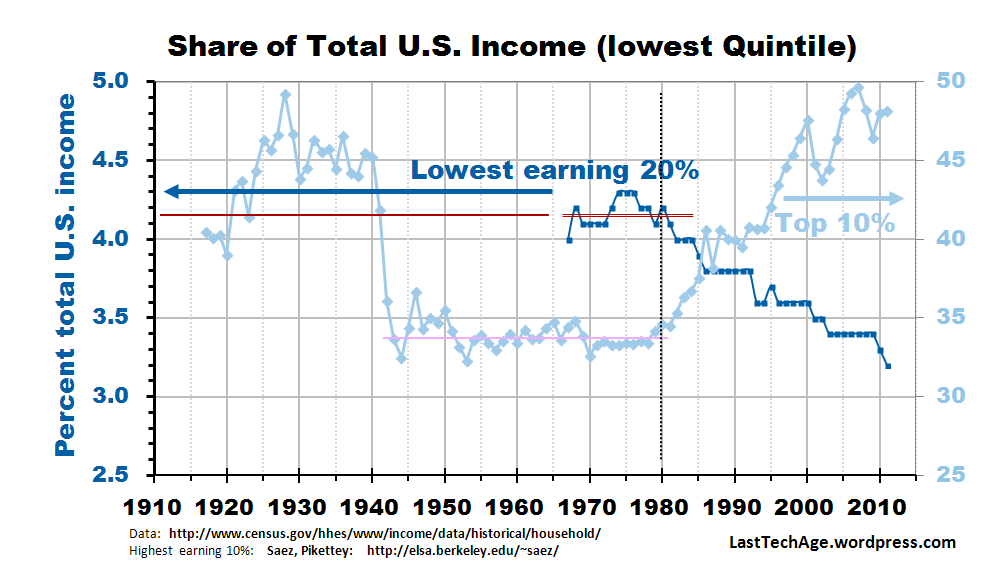
Lowest earning 20% + top 10%
Fig 5 shows census bureau data on the lowest paid 20% of the population with the highest 10% shown in light blue, for visual correlations. Census data set started late and is noisy (they are not so interested in the lower earning levels). But it is perfectly believable that the data from the 1967-1980 are just fluctuations about a flat line, too. The lowest 20% start losing income share in 1981, when income share for the top 10% begins its spectacular rise.

Fig 6: Fusion research + Top earning 10%
Fig 6 shows the timeline for the U.S. fusion energy budget – the American Fusion Engineering Act of 1980 allocated a massive increase in funding and set the stage for a shift from basic research on why things happen to the engineering how-to with Prototype 1 of a net power producing magnetic fusion machine. Correlations to WTID anchor data suggests why fusion funding never really started up.
LastTechAge calls it a Zero Sum Game when you have to describe what happens when growth of one faction requires corresponding reduction by another. With our apologies to game theory, we have a number of posts on the idea. (Refer to our Index under the header for related posts.)
 We will continue to probe other data sets using C21‘s WTID data as a correlation baseline.
Visible even in our example Fig 5 and 6: Unrestricted capitalistic acquisition of wealth seems to focus on maximization of the personal family wealth of select individuals, even to the detriment to the society that makes financial success possible (my statement, not Piketty’s).
In the next section, we discuss how Piketty used the measured total Wealth of the U.S. and its total Income to draw inferences.
Now – Inferences from the math
Someone who comments on a book should read at least the introduction; wouldn’t hurt to read a couple paragraphs of Chapter 1 and probably the last page or so at the end. Many C21 critics seem to have done none of those.
Even in his introduction, Piketty states that, without a solid database, economics is not science, just speculation. Page 2, Piketty comments on data-free discussions as “A Debate without Data“; page 3, he refers to ideological hypotheses as “the dialogue of the deaf “, using “intellectual laziness” where one side points to the other side’s intellectually lazy habits; page 11, in reference to Marx and Kuznets he says that without data, one can find “theories” that range from “Apocalypse to Fairy Tale“; page 3 again, “Social scientific research is and always will be tentative and imperfect. It does not claim to transform economics, sociology and history into exact sciences.” These are not words of a rigid ideologue, though Greg Mankiw tries to frame him as one.
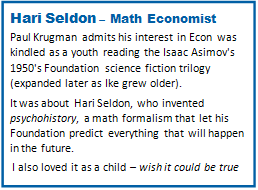
Cmt-B Predictive Econ is science fiction
Economic math models (even those with differential equations) start as the verbal ones do, maybe from divine revelation of an axiom set, maybe a set of blindingly-clear but hypothetical truths.
Several of our posts that say Economics is not Science. Cmt-B discusses SciFi imagery.
Piketty scorns economists who use complex mathematical models, but he does use a few simple equations.
For me to detail how the math is used, I would surely need more than 577 book pages. For good discussions of what it all means, read Piketty’s book or the Science journal summary.

Cmt-C: Algebra of Capital in the 21st Century
The few math relations used are shown in Cmt-C. The content of his resulting inferences are why some high-wealth people are trying to undermine his credibility.
The second law generates concerns. It is given without proof, and means that over a long time period, a country’s beta value (its total wealth divided by total income) will gradually adjust its value to match its average rate of savings divided by its growth rate. This assumes that everything stays in equilibrium: no awful wars, no asteroid hits, no super volcano at Yellowstone Park, etc.
If true, and if the saving rate is constant, a country needs continuous growth to keep its wealth from concentrating into a few hands.
If growth g gets really small (no growth – static population size and static manufacturing productivity), the ratio s/g must become really big. 2nd Law: (s/g) = β = (K/Y) and since capital wealth K cannot grow to unbounded infinity, it must be that the income Y averaged over the population becomes very small – lots of earners with subsistence paychecks.
Oh, wow… Static societies develop into inherited aristocracies with their majority as starvation level serfs . ? !
I have a small question about the 2nd Law. Beta is measured in years but the law convergence ratio is a pure number. Where did the ‘year’ dimension go? I am a physicist and all our valid results keep the measurement dimensions consistent. If it starts as ‘years,’ it must remain as ‘years.’ Maybe my issue is only because I have not seen how this convergence was proven?
The r > g condition is more serious. When the rate of return on capital investments exceeds the growth rate of the country, you should also expect wealth concentration over the long run. Because when the wealth capitalization rate r (return on capital investment) is bigger than the rate at which wealth of the bulk of the population grows, the folks with inherited wealth acquire resources faster (much faster?) than all others. For really large r, new capital flows to the very rich & well connected; all others lose their pool of resources.
r > g is serious without the second law. With the 2nd Law, it acts as a strong accelerant. (Think of what an arsonist uses to start building fires.)
Piketty’s team best model for capital growth uses an economy with with successive shocks – sudden and unanticipated changes in the fortunes of various subsets in our economy. We are currently passing through such a “shock.” in 2009, the rich and well connected got huge government bailouts + monster bonuses. But manufacturing had been hustled off shore and most of us found lower paying jobs waiting to replace what we lost.
Finally: The model is not the thing, the map is not the territory.
The model points toward wealth concentrated into a few hands, especially if you include resource depletion and climate change as forcing elements. But the issues are complex, and include forces that push toward inequality but also those that push away.
Piketty’s proposal – Install a global progressive tax rate (PTR).
Suppose the capital return rate r does try to rise above the growth rate g. Government can shift the r/g ratio. After all, turning the PTR off shut down the 30 Glorious Years. This is a way to reduce the rate of net capital return r so that wealth agglomeration does not happen. And this is why he is under such extreme attack by the ultra rich and their (much poorer) far right followers.
These seem to be our choices:
(A) a feudal oligarchy where the very rich rule our impoverished people, or
(B) a revolutionary oligarchy where the very rich rule our impoverished people, or
(C) an increased share in the support for our country paid by those who rose to the top via the American avenue of opportunity.
click for our discussions on economic inequalityPiketty says that his model shows a potential direction, but does not predict the actual future. (C) is certainly possible, the world is not required to follow the path of inequality that leads to injustice. We could, in fact, return to the “Glorious Years.” It is just that, in his opinion, (C) with its PTR action is the most unlikely choice the country would accept.
The final statement of the Piketty and Saez inequality summary.
“To summarize: Inequality does not follow a deterministic process. … There are powerful forces pushing alternately in the direction of rising or shrinking inequality. Which one dominates depends on the institutions and policies that societies choose to adopt.”
………………………………
Charles J. Armentrout, Ann Arbor
2014 Jun 26
Listed under Economics thread Economics > Inequality
Have a comment? Click on the title of this post, go to bottom, let us know.
Related posts: Click the INDEX button under the Banner picture

Wow – I’ll have to read this post much more carefully, and the followup ones.
Plus the book – though I doubt I can handle most of it. CFS has robbed me of any abilities I had in that direction.
But it also sounds like a good book to get a passing acquaintance with. Economics not being science doesn’t mean it can’t be good statistically. Data can be manipulated like crazy, but if done correctly reveals many useful pieces of information. I was already aware of income disparities being massive, but the degree is frightening.
Thanks, Charlie.
LikeLike
Yes, frightening and what it has already wrought is staggering. My suggestion: If you want to get the semi-tech overview, download the PDF linked to at Saez’ site. (near the top of our section “What Capital … Says.”) Good and quick reprise, but C21 is much richer in content, of course. Have fun
LikeLike