Obama, Compromise and Drew Westen

Can Society improve by Obama’s contiuous compromises?

The New York Times printed a stunning analysis of Pres Obama today, Sunday, August 7, in its Sunday Review.  The front page article is “What Happened to Obama” by Emory University’s Drew Westen.

I nearly  passed this over.  It was on the front page, dominated by a huge meaningless picture of boxing gloves with a few starting paragraphs and really lots of beautiful white space.    The NYT recently gutted its Week In Review and replaced it by a meatless section – lots of  comic strips and white space.  (You and I don’t have a very long attention span and these things make us feel good.)   The editors had done their best to divert readers, and nearly succeeded with me.  But my wife pointed it out.  It is so very perceptive, I decided to add it into my Post lists.

Obama seems to compromise until there is nothing left of his position – giving away everything that counts in the name of sweet harmony and peace.  I think of him as the American Neville Chamberlain.

In 1938, the British Prime Minister went to Munich to reverse the beginning of Hitler’s invasion of Europe, and came back granting all the demands of Germany and Italy.  The News Reels show him smiling and and jubilant upon his return:  Peace in our Time!  The rest is history.

click for more posts on the general direction of our society

Usually, I don’t draw attention to a political piece, but it dovetails with LastTechAge theme that we have been slipping backwards for some time and that our current state of technical excellence is being undermined by current political events.

Obama has actually compromised with the people who publish web site pictures of prominent people with target grids over their faces.  Will no one rid me of this pesky person?

At any other time in our history such behavior would have been recognized as incitement to murder, treasonous behavior, tantamount to raising arms against the people of the United States.  The people Obama “compromised” with are certainly seditious.  After all, “Kill the beast” does not refer to the Mountain Grizzly bear.  But on the positive (?) side, the investment bankers who destroyed our economy did get their annual bonuses, each worth the annual salaries of 50 to 100 normal workers.

From the column  “…the arc of history does not bend toward justice through capitulation cast as compromise.”   The italics are mine.

I cannot add to this piece.
It stands on its own, the outstanding column published this year.

Charles J. Armentrout, Ann Arbor
2011 August 7
This is listed under  General
Have a comment? Click on the title of this post, go to bottom, let us know.
Related posts: Click the INDEX  button under the Banner picture

Posted in General | Tagged , , , | 1 Comment

Metal Resources, Asteroids and Obama

Pres Obama canceled the return to the Moon and manned exploration of Mars on April 16, 2010.  But, he did say we were going to go to the moon, Mars and the asteroids by 2025-2030.

No, this is not a rant on doing things for nothing, nor on assuming private space companies could buy enough firecrackers to get us there.  Nor on chances that we could coax the nice Chinese to let us tag along on the rockets they are building.   No, this is a comment on my personal response to Obama’s asteroids:  “Huh?  Go where?”   Why in the sky would we want to do this when the Moon and Mars loom so strongly in peoples minds?

Recently, the New York Times had letter on Obama’s “initiative” followed by responses published 2011 Jul31 in its Sunday Review section.  Going to the asteroids does not fire imaginations but this review got me to think about it again.

Conclusions   … reasons at the end

We actually should go to the near Earth and Earth-orbit crossing asteroids fairly soon.  But not for Space.com’s assumption that this is to Save The Earth from asteroid bombardment as in a Hollywood sci-fi flick.  Good rigorous scientific analysis of that threat is being done; we understand how to divert threats if seen early enough, but it is all theoretical.  Save the Earth may, in fact have been on Obama’s mind.  But it does not make enough sense to fund this right now.

We still should go,  but don’t send Bruce Willis or even Robert Duvall.   Send out our metallurgical engineers to map the chemical composition of each object visited.
Yes!  This is a post on peak-resources.

This is our century for resource shortages.  Oil we all know about, the U.S. peaked its oil production in 1970 despite huge efforts pump more.  Saudi Arabia has probably peaked production from the largest resource pool on Earth.  But copper, nickel, and many other minerals are likely to reach peak production this century.   By the way, the title of the blog is The Last Tech Age  because, if we lose the ability to make technology, the human species will never be able to rebuild to even 1990 levels of competence.

Reasons – We are going to need new reservoirs for materials

PkOilThe methods for estimating date of peak production were discussed in Peak Oil -Predictive model.  We need two pieces of information derived from data for the commodity.

  • How many years the reserve will last if current production is maintained, without growth.  We call this Y0.
  • What the rate of growth in demand is.  What the average increase in a years’ production is over the previous year.
    We call this r.

Getting Y0 requires a well developed estimate of the size of the economically extractable  commodity and the  total used this year.
Finding r  requires production data forthis year and last year, at least,to get an idea.  Actually, we need decades of reliable production data to first verify that production is in “exponential” growth and to obtain a reliable rate from the trendline.

Find the interval to reduce the reservoir to one half use T = ln(1 + r·Y0·1/2) /r.   (This formula was derived in Page Using A Finite Resource.)  We examine a couple commodities.

Copper Production, 1900-2000Copper (Cu) – Production is shown here and is pretty clearly exponential growth with significant market instability.   The blue line is the calculated exponential fit for a century of data; production growth rate is 3.3%  (r = 0.033).

CuPk_tblThe USGS tables show World demand at 16.2 Mt in 2010, and 15.9 Mt in 2009.  The total world reserve (proved and guessed) is 3 billion tons  (3 Gt = 3000 Mt).  Apply the peak commodity time formula. Peak copper might occur in the mid 2050s.

By 2053, we will not even be close to draining the Earth of its copper resources, but the mines will have to become much deeper than currently done, possibly going 30 miles down (48 km), according to some published estimates.  Environmental copper will still be too diffuse to be economical, but sea nodule harvesting may become marginally economical.  Copper may approach silver in expense.  Space exploration could be reasonable, if the survey studies were in place.

Nickel (Ni) –  This is not rare in the Earth, currently, it is thought that the deepest parts of the Earth are largely nickel.

NiPk_tblA 2009 estimate has usage of nickel growing at a 3.1%/yr rate. Primary (not recycled) consumption is about 1 Mt each year.  Oriel Resource says nickel makes up about 0.0008% of the Earth’s crust, so nickel must be extracted from high concentration mineral deposits.  We have about 100 yrs of available supply at current rates.

Notice that nickel and copper linear lifetimes differ by a factor of nearly 2, but the time to 1/2 usage is almost the same  due to the exponential form of the growth.  These estimates demonstrate  that the formula is robust against minor increases or decreases in resource estimations.

Hydrocarbons (HC)  –  In our discussion about asteroids, does it seem strange to include oil and coal which are both attributed to squashed up dinosaurs and vegetation?  There are reports of HC detection in non planetary bodies such as these.  If we had a large external pool available, we would use it for the extraordinarily important supply our chemical industry needs.    So, we HCs, because this may be our most urgent need, in the very near future.

Petroleum has been covered, we are close to the world peak production, and may have already occurred.  The data on this and other vital HC products (such as coal) is somewhat obscured by our current world politics and the near depression level economic situation we are facing.

Coal –  This is responsible for a quarter of the primary energy and 40% of global electrical energy.  It comes in 4 types: anthracite (about 30 MJ/kg), bituminous (18.8-29.3 MJ/kg), sub-bituminous (8.3-25 MJ/kg), and lignite (5.5-14.3 MJ/kg).  Peat is sometimes treated as a sub-lignite grade, but we will not concern ourselves with this.  Anthacite and bituminous are called “hard coal,” at the low energy lignite end it is “brown coal.”  Production for high grade anthracite peaked early in the 20th century. Coal is produced mainly in a handful of countries – USA, Russia, China, India, Australia, Germany, S. Africa, Ukraine.

Discussion usually concerns the other 3 readily available grades.  Find industry analysis here  BP, Inc.

The graph is from a careful 2007 analysis by EnergyWatch.  Peak analysis is muddied by the different energy grades, this chart puts them together in terms of energy production as though it were oil.

Again, we see a broad peak starting in 2020, and becoming ever more important through 2050. Do HC’s hide out on asteroids?

Summary

click for LastTechAge posts on space technology

This 21st century will be one of shocking changes in our world. Many more commodities will move out of reach than just the ones shown here which peak 2030-2055.

Sometime about when most of you dear readers start to age, and your grandchildren are entering adulthood, we must either have a replacement or be ready to weather a significant and permanent degradation in “industrial world” lifestyle.

OrionAssist_imb

Doves to the asteroids. Click for larger image

Obama’s call for the exploration of asteroids is actually visionary, although I suspect he was thinking of a Hollywood mass impactor story. We need to do the metallurgical studies to happen in the next decade so that we can actually prepare for deep space mining operations.

FINALLY, there is a real goal for our space program, one with financial bottom lines that even a CEO might understand.  I wish we could do this.  I wish we would do this.  Unfortunately, Pres Obama seems to project a flight of doves gently lifting the space capsule.

Personally, I think he needs something to get the birdies out of the planetary gravity well –  maybe the tooth fairy can tie gossamer bonds and do the heavy lifting, the doves can take over after that.

—————————-

Charles J. Armentrout, Ann Arbor
2011 Aug 1
Have a comment? Click on the title of this post, go to bottom, let us know.
This is listed under   Technology     …thread  Technology > Space
Related posts: Click the  INDEX  button under the Banner picture

Posted in Technology | Tagged , , , , , | Leave a comment

Revert to policy

I made a mistake recently.  This blog has some clearly stated rules and regulations, here is part.

All comments must be signed.  Anonymous postings are the hiding place for the irresponsible,  a pool for festering nastiness.  If you have something you would like to contribute, you must admit to being the author.

I accepted two comments that had only the first name.  The author clearly did not want to be identified with his ideas.   Though the internet should be a brew of exciting ideas, an idea is not real unless the person  who releases it is willing to stand behind concepts.

The standard internet tendencies took over,  due to anonymities.  Scathing adjectives were exchanged, we had a good old public temper tantrum at each other, any 6 year old would have been  proud.

In the future, All such comments will be blanked by the comment that the author did not follow the rules established in the Page “About The Last Tech Age.”

Some commentors have put in their full name and stand behind their statements.  These have always been posted and will always be so, as long as there are no personal attacks.    I apologize to you for my recent slip.  It will not happen again.

Charles J. Armentrout, Ann Arbor
2011 July 27
This POST is uncategorized. Find all other posts on INDEX page

Posted in Uncategorized | 2 Comments

In the balance: James Webb Space Telescope

We are at the tipping point of losing a potential National treasure, the James Webb Space Telescope (JWST).

JWST_dwg

Artist conception James Webb Space telescope

The JWST is a very large telescope to be launched into space to view the universe with ultra high resolution infrared (IR) images.

When launched, it will take its station at the L2 equilibrium point, 1.5 M km on the other side of the Earth from the sun.  It will be in solar orbit but trapped in the Earth’s shadow which will mostly shield it form solar heat radiation.  The JWST will have a heat shield between it and Earth so observations will not be disturbed by planetary heat emission.

WolfMikkulski_img

JWST – Cong. Wolf cut, Sen. Mikuklski support

The magazine Science is published weekly by the American AAAS.  According to its  2011 Jul15 issue, the current majority of the House Commerce, Justice and Science subcommittee (jurisdiction control over NASA)  is opposed to the expenses and timeline currently projected for the program and cut out its funding authorization for the 2012 budget (stating in 2 months).

Congressman Frank Wolf (R-Va) is Head of the subcommittee and leads the effort to cut off support and end the mission.  Senator Barbara Mikulski is vocal in her urging of reinstatement of the original support.  Sen. Mikulski is a well know supporter of NASA.

In 2000, the National Research Council released its once-every-10-year Decadal Survey in Astronomy  and put the JWST as the #1 priority research instrument.  It was to be  the next generation successor to both the Hubble Space Telescope (HST) and the Spitzer IR telescope which was not actually launched until 2003 because it was recognized that such an upgrade in size and capability would require a long time to bring to fruition.

JWST-HST_dwg

person, HST (4.5 m2 area) JWST (25 m2 area)

The JWST will be made up of 18 mirrors of gold plated over beryllium.  The mirror assembly will form a mirror 6.5 m (21 foot) in diameter that will view the universe’s light emission from the visible red 0.6 µm to the far edge of the near IR at 28 µm (the part of the low-energy/long-wavelength spectrum that is the deeper red than visible red light – redder than red). Read our discussion of wavelengths here.

Due to JWST’s huge step in capability, it is called the next generation telescope and the next step after the HST and Spitzer spacre scopes because it is a huge step up in capability.  Actually, the JWST stands between the HST and Sptizer. Continue reading

Posted in Technology | Tagged , , , , , , , , , | 7 Comments

Farewell to American Manned Space Operations

Yet another chapter in U.S. technical excellence has closed.

FinalAtlantis_img

Final decent of Atlantis into darkness

What have we lost? What have we accomplished?  What will we do?

This last flight of the Atlantis provides a reason to review the melancholy  history of one of our greatest achievements.

Go to Infrastructure-1,  Saturn-Apollo
Go to Infrastructure-2 ,  Space Transportation System and the ISS
Go to What’s Next,   trying to make sense of this.
Go to Infrastructure-0,   X-program space planes

click for LastTechAge posts on space technology

This is a sad recognition of mighty things that were done, could have made a large societal difference, but were discarded.

____________________________________________

Mercury7Astronaughts_img

The 7 original Mercury Astronauts

Timeline 1959-1972: Man-In-Space, Infrastructure-1.  The U.S. Man-In- Space program started in 1959 with Project Mercury leading to the selection of the first 7 U.S. astronauts.

MerAt_img

Launch of John Glenn orbital mission

Alan Shepard was the first American to ride a rocket (on suborbital mission MR-3).  John Glenn (MA-6) rode an Atlas ICBM into orbit.  At least 10 Mercury capsules were built and 6 missions launched (1961 May05 – 1963 May15).  Mercury was replaced with 10 missions of the 2-man Gemini capsule, 1965 Mar23 – 1966 Nov11-15. Gemini tested capabilities needed for the final lunar landing phase of the program.

The unused Mercury and Gemini capsules went to technical taxidermists who mounted them to display in all kinds of museums.

SA-506_imb

Saturn 5 launches Apollo 11 to the moon.

ApolloCSM_img

Apollo-15 1971 lunar orbit

The Apollo moon program (1961-1972) was given political priority by Pres Kennedy, 1961 May25, although the concept of a lunar lander project had been approved in 1959.

The first Saturn/Apollo launch, SA-3, testing a mockup capsule,  was on 1962 Nov16.

Spaceman_img

1971 image of Apollo 14 Astronaut

Apollo 11 (SA-506), 1969 Jul16-24, was the first of our 6 landings.  The last lunar mission was Apollo-17 1972 Dec07-19.

The last Saturn V was launched 1973 May14, when a smaller 2 stage version carried the Skylab station to orbit.

Skylab-Saturn_img

Skylab station launched by Saturn V 1973, final crew launched 1974, Apollo on smaller IB launchers

Timeline 1973-1975:    Skylab (1973 May14-1979 Jul11) was a serious scientific space station. The Apollo lunar solar observatory that had been mothballed when the Lunar landings were stopped, became one of the main instruments installed.

Skylab_img

Skylab from Apollo 1973 3rd mission

Skylab had 3 manned missions during its  10 active months.

To be or not to be?  That was the real question, The Skylab team had uses for all the remaining Saturn launchers, and had plans extending deep into the Space Shuttle days for developing a much larger facility that might even have been in use today.

Shuttle program delays kept it from providing Skylab with its necessary orbit boost. Since it would have re-entered in an uncontrolled way, it was de-orbited in 1979 Jul11.

Soyuz_img

Soyuz-19 from Apollo “18” 1975 Jul18

1975 Jul15 was the last launch of the Saturn/Apollo program. This was for a diplomatic rendezvous with the Soviet Soyuz-19.  The rocket was a 1B similar to those that launched the Skylab crew.

At the end of 1975, there were 2 fully functional Saturn V launchers on hand, and an unknown number of Saturn IB and Apollo modules.  These were “abandoned in place” and the drawing set was broken up and sent, in pieces, to safe repositories all around the U.S., whereabouts currently unknown.   Some of the spare Pratt-Whitney F2 liquid hydrogen engines made it to various museums to serve as door stops and outdoor art. Continue reading

Posted in Technology | Tagged , , , , , , , , | Leave a comment

Fluorescents-2: Lifetime

Compact fluorescent lights (CFLs) are mandated for the US market starting in January 2012. These bulbs certainly have good press; they are more efficient, last forever, give nice bright light, and modern CFLs can be dimmed and will turn on in cold areas. These are nice attributes.

Summary to here

Acronyms_lst

Accronyms

Efficiencies were verified in Fluorescents-1; compared to ILBs, they show really good gains and long lifetimes.

FLs have primary illumination in two very narrow regions of UV wavelengths, then down convert to visible light. ILBs effeciency generate light at low energy wavelengths longer than 1 micron and only that 10% of the generated light (that in the visible range) is usable. Lumens measure the photonic power emitted by the bulb and we restrict this to the visible light region. Watts measure the electrical power provided to do this emission. Efficiencies of 67 Lm/W are appropriate for CFLs while 15 Lm/W is reasonable for ILBs.

click for a list of LastTechAge posts on illumination technology

Lifetime estimates need more discussion.  In Fluorescents-1, we discussed how lifetime could be reduced by the manufacturer taking shortcuts.  We also discussed that the local power grid could cause premature tube failure by delivering voltage spikes to the bulb.

How to shorten the rated lifetime

There is a third mechanism for shortening fluorescent bulb lifetime that should be discussed — frequent on/off cycles.  Review fluorescent light operation here (PDF).

A very good review of 12 effects that will shorten the lifetime of a fluorescent lamp was written by  R.V. Nesari  and available  here (PDF).  The lifetime listed in literature for any bulb is the result of a test where, typically, a bank of lamps are turned on for 3 hours, then switched off for 20 minutes (to cool down), cycle repeated repeated over and again.

Switch_img

Frequent power cycles damage CFLs

Rapid cycling.     The very best way to use a fluorescent lamp of any type is to have it operate for a very long time.  Some manufacturing plants never turn their lights off; offices will have them operating for 10 to 12 hours a day.

This is the most efficient use and the source of the justifiable claim that fluorescents are much cheaper than incandescents.  Fluorescents won the lighting wars in commerce, based on their own merits.   If you must leave lighting on for a very long time, use fluorescents.

Once generating light, the CFL has only small losses of its filament and associated coating.  The stress of the sudden very high voltages surge at turn-on causes highly enhanced sputtering and evaporation.  The rule for long lifetime:  do not cycle very often.

On the one hand:  The problem is partly due our basic training –  We learn in childhood to turn of lamps when we leave rooms.  It is a stressful time to get the child to switch off bathroom lights, closet lights, desk study lights, etc.  It is pretty clear that if you leave a light on for hours, you (or your parents) have to pay for the energy used.  You pay for 1 kWh if you leave ten 100 W lightbulbs running for an hour.   If you leave the fixture with two 40 W fluorescent tubes running all day, you obviously will have to pay for almost as much as the 100 W bulb, the internal urge to switch it off is there.

On the other hand:   if you turn your CFL on and off too often, you could be blowing the filament and find yourself changing bulbs after several hundred hours.  These things are expensive!  If you do find yourself changing a CFL about as often as a ILB, then you could pay 5 times the bulb price or more.  No win situation here.

How much lifetime reduction?   a 24 W CFL generates about as much lumens as a 100 W ILB.  About 1:4 in power use, and perhaps 5× in price per bulb. That means you may use a CFL bathroom light for 25 minutes for the same cost as a 100 W ILB for 5 minutes.  But you turn your lights off when you leave the room, right?  Is there a point when cost of CFLs vs ILBs rise above the incandescent cost of power?

These tables  summarize an attempt to look at the  condition where you are intent on minimizing the bill from your power company.

TestModels_TblUsage A: You walk into a room in your house and turn on the light for an average of 25 minutes, then turn it off.  5 minutes later someone comes and and does the same.  Usage B has be same thing but you just walk in then walk out again (closet model).  5 minutes lights on, 5 minuts lights off.    In A, the lab cycle is 5.7 times longer than your usage cycle; in B, lab is 20 times longer than usage.

Lifetimes_tblNow we need test data on the more realistic cycles A and B to measure the lifetimes.   Oops, these data are not available.    Sorry, we cannot figure out lifetime reduction  values  due switching!

I would guess that after the first several years (maybe by 2015), we will find self-righteous magazine articles telling us to leave the lights on all the time.

Overheating    This is another way to kill a CFL.  The fluorescent tube is only little bothered by temperature, but the built-in electronic ballast in each CFL will die quickly.  The failure rate of sensitive solid-state electronics goes up about 2 for every 5º C (9º F) increase in temperature over room temperature of 25ºC (77º F).  This effects outdoor lighting (where there are hot summers) and orientation of mounting.  The ballast is at the base of the bulb.  If the bulb is put upside down into a ceiling fixture, the (not insubstantial) heat generated by the bulb will cook the ballast.  This shortens the life well.  Nowadays, some CFLs with much more expensive ballasts exist and you can use these upside down without huge loss of lifetime, but you pay for this.  Temperature has other consequences, though, and we will return to this in another post.

CFLs are used to as intended – Energy impact

To reach the bulbs rated lifetime, you should not turn off the lamp very often.  This is why commercial interests are nearly 100% FL users.  Now consider use in a house with 30 lights.  Prior to change-over, all were ILB with an average of perhaps 75 watts (combination of 100, 75 and 60 watt bulbs).   By 2013, all lights will have been changed to CFL bulbs, with the same illumination characteristics (net lumens will be the same before and after change-over).  Will  you use less or more energy with CFLs?

AvPwr_tblUse data from Fluorescents-1:   75W  ILB generates about 1100 lumens, the equivalent CFL will need 20W of electricity.  Suppose your active time at home averages 8 hours.  When you used ILBs, they were ON about 20% of the time.   After change-over,  the bulbs are ON the whole time, as in an office.  The average energy used is the product of every cell along the row, as shown.   Yes there are quibbles to be made with these assumptions.  But the point is, CFLs are NOT the universal energy saver they are advertized as.  

ILB:  3.6 kWh  vs.  CFL:  4.8 kWh.  CFLs, used as intended, are not at all a bargain.  You pay increased power bills,  pay for expensive bulbs,  and potentially add to the hazardous waste load in the environment.  If you are ultra careful perhaps the effective use is 10% of the time,  then it is ILB 1.8 kWh to CFL 4.8 kWh.

This argument does not work if you do not turn of your incandescent lights when done.  But, since you are not concerned about energy costs or use, this discussion is moot.

One might argue that switching lights off is one of those utopian propositions, like saying everyone will send their spent CFL lights to special recycling centers.  No,  CFL ‘utopians’ must go out of their way (do things that increase cost a bit) to comply.    The ILB ‘utopian’ acts in monetary self-interest.  Do it right, save money.  The person doing the action receives tangible gain.  This is not a utopian assumption.

Summary of CFL considerations

Efficiency: the award for electricity into light goes to the fluorescent lamps, if no one cuts corners.

Lifetime:  The award for least energy used goes to incandescent lamps, if we try to reduce immediate out-of-pocket costs and switch them on and off frequently.  Frequent cycling of FL bulbs will shorten lifespan by (data unavailable)  hours.  If we leave every CFL on that we switch on, we can estimate that ILB bulbs use less energy, or in sloppy households, at least break even.

UPDATE, 2011 Jul 21.  My best critic and gentle wife ‘politely’ said that algebra done in a paragraph is hard to follow (words to that effect).  Well, yes.  So I turned the numbers into a table and clarified the text a bit.   Sorry for the late change, I hope this is easier to follow.

Charles J. Armentrout, Ann Arbor
2011 July 20
Listed under   Technology   …thread    Technology >  Fluorescents
Have a comment? Click on the title of this post, go to bottom, let us know.
Related posts: Click the INDEX button under the Banner picture

Posted in Technology | Tagged , , , | Leave a comment

Fluorescent-1: Efficiency

What’s not to like about compact fluorescent lights (CFLs)?  They use less energy than incandescent light bulbs (ILBs), they are cheaper in the long run, they put out lighting with selectable  hues, they are environmentally friendly, and they are directly available for all the lamp sockets in all the electrical energy using homes in the world.

CFL_img

Typical CFL bulb, ready for the socket

CFLs are so green they rank high on the list of  non-controversial good-guy bumper sticker topics.

But is it true?  After we go through many of the issues, our conclusions are:   If everyone cooperates with CFL use,  then the general happy conclusion is quite possibly  right.  If anyone takes shortcuts then we may be in trouble.  I think CFLs may,  indeed, represent a bumper sticker-green issue,  but they come equipped with the inherent problems of all utopian schemes.

If the manufacturers cut corners to increase profits, if the user tosses the bulbs into the convenient trash, if standard city recycling procedures are not careful enough, if the landfill operators do not search the bags being dumped,  and finally, if the user makes the the wrong  selection, CFLs will be less than satisfactory and perhaps environmentally dangerous.  Here are several acronyms used:

Acronyms_lst

CFLs are most efficient.

Here, efficiency  means the ratio of how fast your bulb emits light energy (measured in lumens)  to the electric power needed to generate this light (measured in watts).  Efficiency is the ratio of powers.

Quick aside.  Energy is what you pay the power company for.  Power is the thing measured by the meter on the wall; it shows how fast you use that energy.   Power is measured in Watts (W) and indicate how fast the electrical energy flows into the light bulb.  Lumens  (Lm) is the number that tells how fast the bulb generates light energy that  flows from the bulb.

ILBrateW_gph

ILB Light power out vs input elecrtric power

ILB:   A 100 W light from my shelf is rated at 1550 lumens, 15.5 Lm/W. It has a 1500 hr rated lifetime.   I conducted an informal study of a range of from several internet sellers, this study is neither complete nor comprehensive.  Bulbs have different lumen ratings, and the range for a given wattage and variation can be large. This is a recurrent comment on ILB, FL and CFL bulbs.

ILBLm/W_gph

ILB conversion rate into light for range of Watts

We really have to stop looking at wattage level when buying a bulb.  If we only want to control power expenses, we should leave the lights OFF and go about in the dark.  If we want to light the room, look for the brightness rating – its lumen value.

These figures are my informal (non-rigorous) review of the ILBs offered for sale today (July 2011).  As you can see, there is a considerable spread in brightness for any watt you purchase.  Dotted lines are hand-drawn to aid visualization. The wide spread in Lm/W at any given bulb wattage is due to the many different ways to assemble a bulb; these are manufacturing issues.

click for list of our general discussions (in PDF) on lighting and visual response

For any Watt value, the very highest Lm values usually corresponds to the shortest lived bulb, usually 750 hours. The very lowest Lm values to correspond to the cheapest bulbs.  In between, the estimated lifetime ranges from 1.5 k hours near the top Lm to 20 k hours nearest or at the bottom Lm value.  ILBs become more efficient as the watt rating rises.

How ILBs work – Electric current flows through a thin metal strip (the filament) mounted in an evacuated bulb. The filament heats and and radiates nearly as a blackbody object.  For a 75 W bulb, the “blackbody temperature” is about 2700 K.    These bulbs are efficient radiation generators, but light emission peaks in the long wavelength IR (infrared) region where at least 90% of the energy is emitted.  Since IR light is not visible it is wasted.   As the wattage increases, the temperature of the filament increases and the peak emission moves closer to visible – the bulb becomes a more efficient generator of visible light. Ref our general PDF:   What Does Color Temperature Mean.pdf

CFLLm-W_gph

CFL Lumens generated for watts supplied

CFL:   I did a similar web search for compact fluorescents.  I want to compare with IFL so these are selected data. All points are for  bulbs rated with a   Color Temperature of 2700 K.  No other temperature is included is in this set.

CFLLm/W_v_ W_gph

CFL Conversion rate (Lm/W) for Watts electricity

Conversion effi- ciency, Lm/W shows  a lot of variation.

CFL efficiency is the clear winner over IFLs.  Offices and factories across the nation and around the world are illuminated by them.  These is no  contest for their use in commercial buildings.

In many CFL-booster texts, a value >  70 Lm/W is used.  Just by looking at the graph, we can estimate a more accurate value of 67 Lm/W.  Notice that even if we used the lowest value of 35 Lm/W, CFL efficiency is better than twice that of an ILB.

Conversion efficiency of 67 Lm/W is probably a better  “typical” value than either 75 or 35.  This is a very small sample size.  The largest variation is 30% for the 15 W electric input.  30%  may be a better figure of merit, than the tighter variation for the rest of the graph.  The right way would be a truly random selection with many samples of CFL bulbs across the wattage range, rather than my quick survey.

30 percent?  One should expect better consistency than this from brand to brand, because CFL light generation is standard: vaporize Hg, run a current through it to excite emission of UV, convert UV to visible at the inner coating of the tube.  These are all well understood effects.

This highlights the difference in visual light efficiencies between CFL and ILBs.  ILBs are highly efficient thermal light sources, but most of the power is out of the visual range, in low energy long wavelength infrared that cannot easily be up-converted to visible.  CFLs rely on atomic excitation to emit ultra violet light – a process less efficient than thermal emission.  UV is also out of visible range, but in higher energies which are easily down-converted to visible.

For more discussion, click on our link (above) for “How Fluorescent Lights Work.pdf”

The first question about this efficiency discussion must be –why the difference? The physics says fluorescent must be more efficient, overall, and TV tubes have been made in quantity since the 1940’s.  The result cannot be a structural CFL issue.  Fluorescent  bulb manufacturers obviously do not to bring up these topics.  The intrepid LastTechAge Commentator will now set aside his experimental science background,  abandon further searches for unavailable data, and enter the wooly realm of anecdotal evidence.

From my viewpoint: the large variation must be due in part to manufacturing short cuts.   Here is my data.  We put in an FL lamp (F13T5 tube) over the stove in our newly rebuilt kitchen about 20 years ago.  The tubes were about 5/8″ diameter, 20 in length (16 × 500 mm).  They lasted 10 years, but when replaced, they failed quickly. The burned tube had turned brown.  I replaced them several times, as well as the entire fixture – actual lifetime was between 3 weeks to 4 months.  The only thing I could see different was that the US factories closed and the tubes were made in China.

  • Shortened life – Manufacturing. A fluorescent tube must be really clean before end assembles are attached, and then it must be pumped down into hard vacuum. This is an important step for proper operation.  Oil sealed vane pumps or turbo-molecular pumps can achieve this but leave an oily residue on the walls .  (You can actually smell the oil after you vent the chamber to atmosphere.)  Oil will poison the FL discharge and will reduce actual lifetime to tiny fractions of the reported one.  No, I did not do a forensic test on my spent tubes. There are also other manufacturing shortcuts that might cause failure.
  • Shortened life – Application issues.   Many use-related issues can cause this, too.  Surges on power lines are one issue.  These are not problems with ILBs but a transient on the power line can damage ballast electronics, or cause the filament to burn out early.  Short cuts are not allowed in either the making or the use of these things. However, we use whole-house surge protectors and am pretty certain surges are not the cause of my sad tale.

Manufacturers in China have been caught using many short cuts,  I am certain this is part of the problem I saw. These guys send over poison for food, polluted substances incorporated into child toys, DVDs that have copy machine scratches, clothing where the threads pull loose.  But the products are cheaper than anything we can produce;  isn’t that nice?  There will probably be a later post on Chinese manufacture of most consumer products sold here in American;  it is one of my severe worries.

Should we allow products to cross our borders when they were not manufactured to at least OSHA and EPA rules?   Say YES if you think this is an issue of interference with other people’s national sovereignty.  Say NO if you think things made like this have questionable quality standard,  basically enslave the local populations into sub-minimum (US standards) working environments, and therefore can have prices well below those a US factory could meet.    Result of our quick verbal poll:  Congress says the YES’s win, we must accept products that deeply undercut home production.  We have seen factories shut down across the US.

Summary –  CFL Have Higher Efficiency.

The physics says yes, they certainly can, and the testing supports this conclusion.  The real world has yet to draw conclusions because issues with actual lifetime vs. listed lifetime might trump the efficiency issue.  Conclusion we have to make:  On the efficiency issue, CFLs deserve a qualified OK.

click for a list of LastTechAge posts on illumination technology

I think that people who complain are ignored because we are tagged as “complainers” – sort of a circular process.  If we did not complain, we must be happy, yes? “This doesn’t work” is not an argument that the bumper-sticker-green ideologues will accept; or perhaps even: could understand.

This is the first post in a series looking at various aspects of fluorescent lighting.

Charles J. Armentrout, Ann Arbor
2011 July 18
Listed under    Technology   …thread   Technology > Fluorescents
Have a comment? Click on the title of this post, go to bottom, let us know.
Related posts: Click the INDEX  button under the Banner picture

Posted in Technology | Tagged , , | Leave a comment

Fusion, Seawater and Stewart Prager’s OpEd

Interesting Op Ed piece in the 2011 Jul 11 New York Times by Dr. Stewart Prager on the status and potentials for fusion power.  Dr. Prager is the Director of the Princeton Plasma Physics Laboratory (PPPL); he does a good job presenting a cogent case for fusion energy.

I want to take this opportunity to reinforce Prager’s Op Ed column and this comment represents a large skip-ahead in my informal posting schedule.

ITER_img

ITER, the international tokamak fusion test bed.   Note man on lower left

Prager’s clear comments respond to the same comment/question that I have fielded for the last 25 years →    “Ok, you say fusion is possible.  So, why have you guys said  nearly every day for the last 50 years  that it will be only 20 more years until we really produce power?”    A variant on this would be  “Now that fusion attempts have failed, why should we put more good money into the private playground of a select few?”

Personally, I usually respond with my 30 sec sound bite:   “Yes, fusion energy is highly feasible, and the time to grid power is probably never.

Prager hit the high points

  • Fusion power is a demonstrated fact  The difficult physics and technologies required for a 100 Million Degree plasma has become highly developed. We know how to build machines to hold such a plasma for  8+ minutes at a time.

I can attest to this.  The “thermometer” type device I built and operated on the Doublet-III  tokamak in the early 1980’s, measured plasma temperature well into the fusion generation range of over 100 M degrees, and held it for at least 5 seconds.  (10 years earlier, I did my thesis work on 10,000 degree plasma in a device that held plasma for 30 msec.)   Such temperatures have been routine now for over 30 years.

  • Fusion research is not the toy of a scientific elite  Fusion is the strong, joint-research effort of many nations.  ITER, the International Tokamak Experimental Reactor, represents the concern by the world’s political and technical leaders about energy supplies this century as petroleum becomes hard to produce and very expensive by 2011 standards (or 1985 standards, too).  The 6 core countries in the ITER consortium are  EU (all 24 members count as one) , Japan, India, So. Korea, China, and Russia.  These have joined to contribute funds and scientists to the ITER program.  To this list, tack on the U.S. as a sometimes partner.

The U.S. is the 7th official partner, currently.  It was one of the original instigators and supporters for a large fusion test device in 1985, helped launch 1988 design efforts for ITER, withdrew in 1999 because it was too costly, rejoined in 2003, about the time Canada withdrew due to its own funding issues, withdrew in 2007 when it withheld FY 2008 funding, rejoined in late 2008 with reduced contributions, proposed 41% reduction in contribution for 2011.  Would you count on the U.S. as a stable partner?

  • National fusion energy technology test beds are under construction all around the globe.  Prager lists China, Germany, Japan, and So. Korea as those with modern new facilities being designed or actually built.  He could have included a number of other countries, but these are the largest, with fusion based engineering issues their primary goals.
JET_img

Inside JET prior to DT ops. Note man on left

The UK has upgraded its 30 year old JET (Joint European Torus) facility to be an ITER test lab  and it has its innovative MAST (mega amp spherical tokamak) unit for innovative work.

We in the U.S. are in the unique  situation of having started the fusion effort with the stellarator design.  We then launched a fleet of large tokamak facilities based on the successful Russian design. We started turning our backs on all this in mid 1980’s.  ITER was proposed in 1988 after our ETR (Engineering Test Reactor) was dismissed out of hand before 1988. By the way, ETR would have had the same target plasma capabilities as ITER. The 1988 proposal for INTOR ( the International Torus) was also rejected, and ITER was finally accepted in concept, in 1988.  

DIIID_img

DIII-D 1985 after vacuum chamber upgrade. Note man at the left.

You say:  So add 20 years.  Why was ITER task not completed by 2008?  No!  ITER began construction only in the last several years.  Start up is defined as first plasma, currently delayed until 2018.  Add 20 to that.

The U.S. still operates its 35 yr old DIII-D facility in San Diego, upgrade of  the one I worked on in the early 1980’s. MIT operates its Alcator upgrades and there are a scattering of other university tokamaks across the continent. 

Sometimes I think we have stopped work on more innovative programs than there are new ideas  (This includes a beautiful spherical tokamak program and an innovative stellarator, both were being built at Dr. Prager’s PPPL).  

  • The United States has lacked the political will to succeed.  Actually, Dr. Prager said we lacked the will — the last 2 words are mine own.  He says that this will not be cheap: $30 billion (30 G USD) to build and operate.  The US economy puts in about $1.5 trillion (1.5 T USD).  ITER and fusion power is costly, but this cost is only about about two weeks of energy consumption by the United States.  He ends with the comment that fusion energy development … “is a litmus test for the willingness of our nation to tackle the tough challenges”.

Funding this is not a task for private industries. Companies, especially US ones, operate on a 3-6 month horizon. Most everything that works and is large was done with Government funds:  the Interstate system, the rail system across the continent (another topic for a set of posts), and our  Space program including the Apollo/Saturn-V moon landers, SkyLab, space shuttles, and the International Space Station.  This Space program redefines expensive.  it almost matches one of our wars – Korea, Vietnam, Iraq, Afghanistan.  The development of fusion energy is dwarfed by these wonderful adventures.

I want to say “Yes, we can,”  but that phrase has been made trite and meaningless nowadays.  The development of fusion power is vital to our national interest, and to all the other countries that want to stay “modern.”  Payoff for its success would support us on through the coming decades and centuries, continuing on for many millennia.

click for list of LastTechAge MFE posts

I am not optimistic about fusion energy development, but I wish the technical fusion folks well.  They are sacrificing themselves to an unbelievably important cause.   I am really afraid trends of the last several decades have generated a sea-change in American attitudes, though.     One of the foundation goals for LastTechAge is to trace what led us,  the American people, to turn our collective backs on energy problems and ignore the vast set of  opportunities for solutions that we held in our hands.

BTW, the image on the New York Times seems to be tied to Prager’s essay.  It is in unbelievably bad taste.  The little editors must have thought a night map of a city with a nuclear explosion at its heart was just so very  fusion.   Did I indicate yet that it is an insult to Dr. Prager and the other scientists and engineers – some of whom I worked with, all of whom I deeply respect?

—————————————-
Update: 2012 Mar 01 The American fusion program is under attack by the budget wonks, read about it at Twilight of the Gods?.   Laser fusions premier facility, the National Ignition Facility is behind schedule in fusion power efforts.  See NIF Retasked? .

Update: 2012 Nov 01  Dr Prager also defends fusion energy after expected NIF laser fails to meet its promise.   Reference to his DotEarth blog response in LastTechAge’s  Fusion Energy – Kill The Beast .

Charles J. Armentrout, Ann Arbor
2011 Jul 11
Listed under   Technology   …   Technology > MFE
Related posts: Click the INDEX tab under the Banner picture.

Posted in Technology | Tagged , , , , , , , , , , | 3 Comments

ANWR and The Lies of Large Numbers

ANWRwilderness_img

Magnificently desolate wilderness

Arguments have raged over use of the Arctic National Wildlife Refuge (ANWR), and will so again.   Probably sooner rather than later.

One side says evidence of a large quantity of oil indicates life in the lower 48 states could be made more secure and comfortable with this resource  – and it won’t bother anyone.

ANERoil_img

Bears just  love pipelines

The other side,  globalwarming.org , msnbc.msn.com, etc.,  believes  that this staggeringly beautiful land should be left to the native American people who live on its shore and kept as a refuge for the arctic wildlife. The web abounds with breathtaking images of arctic wildlife and wilderness; also images of oil lines coexisting with graceful wildlife.

The fate of the Alaskan wilderness has been in contention since Pres Eisenhower granted Statehood in 1959.  Stresses between the rights of  Native Peoples who have been there for 10,000 years and those of corporate development interests who see it as a huge income source have played in court, in congress, in every single White House since then.  ANWR was established by Pres Carter in 1980 in a bill that still is contentious.

ANWR+US_img

ANWR, Alaska and U.S.

Here is a picture of Alaska on  top of the 48 contiguous U.S. states to show scale.  ANWR is the region shown in orange and yellow. The orange region is the mountainous wildlife region, the source of the rugged pictures that abound on the web.

ANWR_detail

ANWR is near the Prudhoe Bay oil fields

The yellow region is the coastal plains region, called the 1002 Area after the section in the ANWR legislation.  This is the proposed location for the initial drilling.  This  site itself is a  8 km2  (2000 acre) spot near the western side of the coastal plain.

Kaktovik_img

Kaktovik is Inupiat village in ANWR

Kaktovak, a small village of native Americans, Inupiat or Iinuit (Canada) or Eskimo (elsewhere),  is located on the peninsula into the Beaufort Sea.

TAPS_img

Trans Alaska Pipeline runs near roadways

As you can see from this map, ANWR is very close to the Prudhoe Bay oilfield that has fed Alaskan prosperity since the early 1970s.

The massive Trans Alaska Pipeline Service (TAPS) leads from Prudhoe Bay  skirting the ANWR boundary, past Fairbanks and ends at Valdez on the south Alaskan coast. The image is from the Wikipedia, and was taken by  Luca Galuzzi-www.galuzzi.com

How much oil in ANWR?

This is the point where commentators start to spew huge numbers the way fire hoses spew water.  We enter the relm I have called the lies of large numbers.  It is hard to see how raw numbers can impact your life; it is really easy to hide meaning and implications in lists of truly huge numbers.

Our basic numbers are from the U.S. EIA. The World used about 84 M bbl/day in 2009, while the U.S. used about 19 M bbl/day,  slightly less than a quarter of the World’s demand.

Unit digression:  These numbers have already become confusing.  M means million (106) and bbl is shorthand for barrels of petroleum,  needed because commodities use “barrel” b to mean other sizes.  The petroleum industry (and our reference source)  use bbl to mean exactly 42 U.S. gallons.  Not just “gallon”  because  1 US gallon is only slightly more than 4/5 of the gallon used in England (1 USgal = 0.833 UKgal) .

I once had a conversation with a British friend describing my great hybrid car with its 47 miles per gallon.  He was totally unimpressed because his did better.  It took a couple of days figure it out  … my car actually made 56½ miles for  his  gallon.

Earth_imgEvery blog is read by people from  around the world and must use internationally acceptable units.   For the record: 1 USgal = 3.79 L
and 1 bbl = 119 L  =  0.119 m3.   All accurate to 3 digits.
Daily usage:  World = 10.0 M m3,  US = 2.27 M m3

We will reference the US rate, but a daily rate is of not much use. We want to know how many years a new site will last, not how many days or hours.  Our actual baseline will be the US annual usage of ≈ 7 G bbl (830 M m3) = 365×19M.  World annual usage in 2009 was ≈ 31 G bbl (3.7 G m3).    G, “giga,”  means 1 billion (in the US)  or 1 thousand million (elsewhere).

The Question:  How much oil does ANWR contain?
The Answer:  10.5 G bbl  (1.25 G m3).  This is the probable size (the mean) per the 1998 U.S. Geological Survey  estimate of between 5.7 and 16 G bbl.  The probable amount in the Federally controlled  1002 Area is 7.7 G bbl  (920 M m3).

Visualizable ANWR size:   ANWR probably holds  18  months at 2009  U.S. use rate (=12 mo×10.5/7).  The 1002 Area holds a petroleum  supply of 13 months (=12 mo×7.7/7) if dedicated to U.S. customers.

This is a tiny amount!   All this  political fuss for less than two years of oil if all went to U.S.?    Not that all would flow south.  Much would sell into the international market;  not to serve the needs of the taxpayers who would pay for its development.  If all went to the open market, ANWR could supply the world  for 1.5  months (=12 mo×10.5/84).

Probable usage rates adds to the question.  The oil companies cannot produce the pool in one large tank.  One could imagine that the start and drain times might be similar to the Prudhoe Bay experience.  Here is a use rate graph, per year.  It shows the U.S. production with Prudhoe Bay added.  ANWR production is added on.  ANWR is projected (this estimate) to last for 35 years, similar to the Prudhoe Bay use.

Rate_gph

ANWR would contribute litte to the US

The graph on the right is my own digitization of the ANWR data from the left-hand graph.  It has bars for each of the years, and when the bars are laid out end to end, they add to about 10.5 G bbl total .  So I believe Georgia Institute of Technology did it right and that this is a reasonable use rate for ANWR.

The maximum ANWR drain rate is 15% of the 2009 demand,  sometime around year 11, pump rate peaks at 1 Gbbl/yr,  only 2.8 M bbl/day (fraction of U.S. demand is 2.8/19=15%).

Only 12 of the 35 years exceed 7% of demand  > 0.5 G bbl/yr  (1.4 M bbl/day).

World market:  the peak 1 Gbbl/yr (120 M m3)  represents about 1.1% of demand (=1/84).  ANWR  is a trivial source on the world market, easily dominated by OPEC policies.

Prudhoe Bay comparisons:   The field was discovered in 1968 and the first well was started but full production  did not begin untill 1977 when TAPS became operational.  Total reserves exceeded 25 G bbl (3.0 G m3),  2.4× the ANWR estimate.  The site covers over 213,ooo acres (864 km2), with 1114 separate drilling locations.  Maximum production occurred in 1979 with 1.5 M bbl/day (179 K m3) sent through TAPS.   Production rate had dropped to 943,000 bbl/day by 2005.

It is highly unlikely that ANWR could produce the projected 2.8 M bbl/day from a small 8 km2  location,considering the max value for the very productive site at Prodhoe (1114 wells on 864 km2 ).  Pumping will likely be at a lower, better distributed rate than projected.

Also, the environmental damage will almost certainly not be limited to the small size popularized on many pro-drilling internet sites.

How believable is the USGS 1998 survey?  This is a good question.  The ANWR survey was based on what had come out of Prudhoe and smaller surrounding  sites, not from geological testing in the 1002 Area.  It is a good time to examine what has happened at the NPRA.

NPRA is West of Prudhoe Bay.    Pub Domain, USGS

The National Petroleum Reserve – Alaska (NPRA) is in the Western part of  the Alaskan North Slope with Prudhoe Bay symmetrically placed between it and ANWR.  This map is in the public domain from the USGS.

  • 2002 –USGS  original estimate,  probable reserve of 10.6 G bbl.
    This is similar to ANWR.
  • 2010 – USGS changed estimate,  probable reserve of 0.896 G bbl.
    This is about 8½% of the 2002 estimate;  based on careful on-site tests.

Is it reasonable to suspect that ANWR and  NPRA are small satillite pools around the original Prudhoe Bay  reserve?  Why would it be reasonable to not suspect this?

Summary:

click for all our discussions about arctic resources

It is true that there is very little oil in either the ANWR or the NPRA,  although it is easy to get confused by the proliferation of all the millions and billions, bbls and m3s.  Not enough in the ground to offer significant  help as oil supplies dwindle, and ANWR is not a source for a terrorists-free energy supply.  If we again made enemies of the OPEC nations, they could dominate our home prices by very small tweakings of their own petroleum contributions.

DAF-iest poster found on various websites.

The ANWR issue is another example of the Drain America First movement.  The DAF-iest strategy appears to be an attempt to put us us in a position of weakness.   Get our reserves down, weaken our armed forces response capability,  ruin our coherence as a people;  then turn the screws.  Shocking:  this is the policy of allegedly right leaning political commentary.

DAF_cmt

Drain America First

BUT.  Suppose there actually is 10.5 G bbl in ANWR, at $90/gallon of oil, this represents   $945 billion US (=$90/bbl×10,500,000,000 bbl).   We probably do not need to examine further the motivation of the forces behind these DAF-iest policies.   I believe that personal family gain has driven most of the hard right-wing strategies for a very long time.

Draining ANWR has nothing at all to do with American energy security, or even the price of gasoline, although it could impact our military readiness.   But it is understandable.

Charles J. Armentrout, Ann Arbor
2011 Jul 02
Have a comment? Click on the title of this post, go to bottom, let us know.
Listed under  
Natural Resources   …thread  Natural Resources > Arctic
Related posts: Click the INDEX button under the Banner picture

Posted in Natural Resources | Tagged , , , , , , , , | Leave a comment

Drain America First

Pres Obama decided to start depleting the Strategic Petroleum Reserve (SPR).  This week he announce that he was going to drain 30 M bbl (1 bbl means 1 barrel or 150L ) oil we have stored for emergency use.

Obama2010_img

President Obama opens the SPR

This not just a bad idea, it is a horrible one; it generates helpless outrage in the people who understand what Pres O  is doing.  Also, it may violate the rules of engagement with the SPR.    In a previous post,  we pointed out that the US has 726 M bbl of oil in its SPR, the largest such facility in the world. The plan to drain 30 M bbl means Obama plans to drain 4% of what is there      …  Is this legal  –  can he do this?   … Is this necessary  –  can he drain this irreplaceable resource?

Legal_cmt

3 requirements

Is it Legal?    Check appendix A2 of of  Are Strategic Reserves Obsolete.    There are 2 formal conditions (3 actual rules) that allow the SPR to be attacked.  [1]  Drain if there is a Significant Shortage In Supply;  [2] Drain if there is a Severe Interruption in National Energy supply;   [3]  Drain if it satisfies “obligations under International Energy Programs.”  At the end of A2 (the above post) click on the slide and read the second point.  It is telling.

We will discuss [1] and [2] in the next paragraph. [3] means the IEA (International Energy Agency) which released a statement calling all member user nations holding reserves to do a draw-down put a total of 60 M bbl oil into the market.

The announcement and related  FAQ sheet  blurs who is doing what.  Example:  North America is putting in 30 M bbl total. Seems to mean Mexico, US and Canada are all contributing hard;  fact – 30 M bbl will be from our SPR in Texas and Louisiana.  An unaccounted amount of the remaining 30 M bbl is from stock manipulations of various types, not real discharges of petroleum fluid into tankers.

The IEA indicates that the oil the US releases is not for US citizens, it will be sold by oil companies onto international market to force a price reduction. This sounds as though it benefits CEOs again.   Guys, we did not build our SPR  for the wonderful comfort of all living creatures.  It is survival reserve meant to help our families, our children, make it through times of disasters or malevolent human actions.   I hate seeing my country making sacrifices so that the few ultra richies get wealthier.  Talk about the return of the robber barons.

WhyRaid_cmt

Why raid now?

Is it Needed?   Rules [1] and [2] lets our Pres pull oil based on need.   I just filled up in the last week.   Drove right in, pulled into a slot and filled my tank completely  (good thing, too.  I was down to the last 1/2 gallon).   A week or so ago gasoline exceeded $4.00/gal, now it is about $3.80. This is not how a scarce commodity behaves.   Gas prices may be the center of conversation in the various bars about, but do not constitute a crisis.

My hair is white so I can recall with scalding memory the 2 to 4 hour gas lines of 1981/82 Reagan gas  crisis,  being restricted to a fill opportunity only every other day, and not filling anything except my car tank.  Ultimately the number of gallons per fill was controlled, too.   Children, this is what is meant by a “significant shortage;”  it defines “crisis mode supply levels.”    I recall the Nixon days when our good friend, Saudi Arabia, slapped an embargo on us.  The supply of oil ran out almost immediately.   Kids, this defines “significant interruption.”  Our current experience does not come even close to either of these situations —  no inflation, no lack of supplies, no shutdown of delivery.

So we will drain 30 M barrels of oil purchased at $30.26/bbl (site costs included). To  replace, we will spend $90 – 100/bbl.  Gasoline prices cannot be driving the decision, they have been dropping lately.

LossGain_tbl

Loss and replacement as % of world demand

The IEA/Obama excuse is that our military incursions into Libya have stopped its oil flow  Libya produced 1.5 M bbl/day, a 1.7 % reduction in available oil on the market (world usage is about 88 M bbl/day).  The proposal is to replace this 1.5 M bbl/day lost with 2.0 M bbl/day from irreplaceable world supply (2.3% of world usage).   It just might work while the reserves last, but the U.S. SPR is only about 8 days of world usage.  After a bit, the world’s biggest reserve would be drained and the strategy must collapse.  This is what “unsustainable” means to an action plan.   We are actually going to do this to counter high market prices.  This is a pitiful excuse to attack petroleum reserves.

Raid summary

Finding not due to Supply issues, had nice effect on Market

After the Presidential Finding, released yesterday, we have a 13 day lag until the oil starts flowing;  our raw crude will hit the markets about first of July.  Dropping gasoline prices will not suddenly go down more because of this; refinery turnaround is about 3 months (Oct).   It did have a 5.5%  impact on the raw oil futures market, though.  Pres O did not respond to supply issues; none exist right now.  Pres O did not respond to any gasoline shortage; we have plenty.  I am certain there must be a reason to drain the SPR, just not the stated one.

I was in shock upon finding a FoxNews post that agrees with my general anger.  They also agree that Pres O’s action smells like 5 day old summer road kill.

DAF_cmt

Drain America First

My consolation is that Fox News belongs to the Drain America First (DAF) club,  Fox may be the charter member.  These DAF-ies  all want to get the big bucks to flow into family pockets and right now.  Foreigners should not be the only ones who can get rich by selling their future, we gotta do this too.  Soon, after we complete the  frac-ing of our continental landscape,  we will have no arable land,  no clean flowing drinking water, no accessible fuel left of any kind,  but plenty of war threats.  Of course, if we do get into a war, we might end up in the same place,  but the DAFies want us to be completely helpless on the world stage as soon as reasonably possible.

Talking heads in the various news channels tend to attribute for/against SPR drainage as a statement for/against general DAF-ie policies.  I disagree.  The DAF-ies are pretty daffy, granted,  but the drain-ies seem to think this oil stuff is just a passing thingy.  My thinking: Oil peaking in the US, Venezuela, North Sea, Saudi Arabia, etc.  means petroleum price must go up.  There can be no quick fix.   This is a recurring theme in this blog.

So what is the justification?  I just do not know, but…  there is a lot of money attached to 30 M barrels of oil.   BTW:  Candidate Obama commented that he was impressed by the market responses when Pres Clinton drained the SPR twice (1996 and 2000).  I wonder if there is something significant about the 4 year interval in Pres C’s timing?  Pres C violated the law and got away with it, so why not Pres O?

click for all our discussions about oil resources

I am strongly opposed to this move. 4% is a big, expensive drain to replace and we will feel any unreplenished loss next time a Katrina scale hurricane hits Florida, or Texas  (, or…)  at the same time as a magnitude 9 earthquake.

Can we do something?  I doubt it.  A lot of things like this happen:  The Pres says “I am going to do such-a-thing,”  does it, and gets away with it.  Pres O has even covered his action with an official-sounding international “agreement.”   And so it goes.

Update: 2012 Mar 11:  The U.S. EIA released a new report this week,  for the first time since 1949, U.S. EXPORTS exceeded its import volume in 2011.  That this happened in conjunction with the first sell-off of our SPR in a long time, is a stunning demonstration that the decision truly was to help certain companies and very rich families, not the American public as a whole. Link over to the EIA site, read the short report look at the lead graph.

…………………………………….

Charles J. Armentrout, Ann Arbor
2011 Jun 24
Listed under  Natural Resources    …thread Natural Resources > Oil
Have a comment? Click on the title of this post, go to bottom, let us know.
Related posts: Click the INDEXbutton under the Banner picture

Posted in Natural Resources | Tagged , , , , , , , | 5 Comments

LISA goes the way of all US tech

On April 6, 2011, the US admitted once again that it would not keep international technology commitments and withdrew from the LISA project (Laser Interferometer Space Antenna) a cooperative agreement with  ESA, (the European Space Agency)

LISA_img

Sketch of operqational LISA observatory

LISA was to be a 3 station system in solar orbit to detect gravitational waves from cataclysmic astrophysical events.  At this current time, ESA is considering building the system by itself.

This development is the latest in a 40 year string of similar actions, forming a solid tradition of withdrawing the U.S. from the development of true technology.

Why/how did this happen?  On  page22 of the June 2011 issue of Physics  Today, David Kramer  has an excellent review  of the politics behind NASA’s painful decision.

LISAwaves_dwg

LISA was to detect gravity waves

Technical overview:   LISA is an observatory to watch black holes or neutron stars spiral in by monitoring the gravity radiation generated.  Such radiation has never been detected before, but we are almost certain that it must exist.

LISA was to be a system of 3 stations that form the corners of an equilateral triangle in solar orbit trailing the earth.  The triangle would be 5 million km on a side  (3 M miles), and each station would have 2 lasers to coordinate its actions with the other two.

LISAorbit_dwg

LISA at Earth solar orbit

Each of the three stations would have two gold-platinum cubes that drift freely in the orbit.  Each station provides shielding for the free cubes and continuously adjusts itself the keep the cubes centered, within.

LISA summary – I’ll bet that you missed the paradigm shattering  consequence of this proposal.    It is not obvious at first reading, but LISA would have had huge leverage on future space uses.

The LISA project uses the lasers to provide a nearly unbelievably stable platform in which it can observe the reaction by the gold cubes to gravity waves.  Think of the 5 M km triangle as on the circumference of a disk 5.7 M km in diameter [D = 2L/√(3) ].  To the gravitation folks, it is an unprecedented next step from the current LIGO program;  it is almost certain to produce positive gravity wave results.  …   Now, what would you do with such a structure?

I enjoy the thought of the gravitation wave experiment, but was really thrilled that an important project would iron out the horrendously difficult techniques to hold this gigantic platform stable.  LISA, from my viewpoint, is the prototype test bed for a visible optics observatory. As noted, the LISA triangle defines a stable encompassing circular platform, 5.75 M km diameter.


So here goes my projected “what if:”   What would you be able to see through a telescope with a mirror 5.75 million  kilometers in diameter?  Think 50-80 years in the future, after the launch of the first LISA and its upgrades.   We would launch an Observing Station Platform. (The OSP is my dream, not anyone’s official proposal).

OSP capability:  At each LISA vertex, put a Hubble-class telescope in interferometric communication with the others. Interferometric imaging is being done today.  The three could form an image with resolution of 1.1 km on a target 1,000 light years out [1].  At 100,000 LY out, the system could resolve spots about 100 km apart.

The actual mirrors would be  HST-sized, not be able to see objects that are too dim for our own HST, but it would have breathtaking feature resolution.  Here is the ability to see detail of nearly every planet in our Milky-Way galaxy.

—————————————————————————————

Apollo 17, last lunar landing 1972

SkylabLaunch_img

Saturn V launch of Skylab 1973

Why stop a 40 year trend?  LISA is not the first American dream that was lost.  We stopped the moon landings just as they were beginning.

We launched our space station (Skylab). Note:  The USSR launched the first  station a few months earlier. We visited Skylab several times but abandoned it.  Skylab burned up at re-entry in 1979.  Although this was the last Saturn V ever launched, 2 more of these beautiful complex machines that were fully built were abandoned in place, left  outdoors in the rain, at the mercy of corrosion.

A discussion of this systematic degrading of U.S. technological ability is one of the goals for this LastTechAge blog site.  We won’t go into much more detail but I want to bring up one more stunning abandonment, the MFTF-B fusion test facility at the Laurence Livermore National Laboratory (LLNL).

MFTFbuildteam_img

MFTF-B team who oversaw the build

MFTF-B was the product of the 30 previous years of intense study of fusion processes at LLNL, using the magnetic mirrors. Design started in the mid 1970’s;  construction was completed in 1985.

MFTf_dgm

MFTF-B was build, dedicated but never operated

MFTF cost about 1/3 billion US Dollars ($367,000,000 in 1985 dollars).  It was dedicated one afternoon in February 1986, the next morning, Reagan’s political team terminated the entire project without allowing it to be be turned on.  Ever.
« I am not a completely unbiased observer, they  were considering buying a plasma temperature diagnostic from my project, similar to one I had invented and built for the Doublet-III tokamak in San Diego »

click for LastTechAge Space Exploration posts

I plan a chain of postings to document a number of such historic trashings of our capability, and will go deeper into the various projects.  But this will await later times.

LISA is a tragic loss.  It is my great hope that the Europeans have the financial will and technical vision to launch the LISA Pathfinder in the next year or so to test the basic communication and coordination concepts the full LISA would need for its launch in 2022 or so.  Good luck,  bonne chance,  viel Glück.

Charles J. Armentrout, Ann Arbor
2011 Jun 14
Listed under   Technology    …   Technology >  Aerospace
Find related posts on INDEX tab, under the Banner

===================================================

1  The diffraction limited, minimum resolution of a lens from the Rayleigh criterion:

d = (1.22 λ/D) L

where λ lambda is the wavelength of light, D is the diameter of the lens, and L is the distance between the object and the lens (all lengths must be in the same units).  Use yellow green light, λ = 570 nm (1 nm = 10-12 km),  D in km, and L in Lightyears  (1 LY = 9.46×10¹² km)

d =6.58×10³ L/D    L in LY, D in km.

for  D = 5.75 M km, and L = 1000 LY,    d = 1.1 km
Return

Posted in Technology | Tagged , , , , , , , , , , , | 1 Comment

Japanese energy decision time

The news has been full of the Japanese problem.  Reuters  and others have been all over Yahoo this week and related news outlets.  Not the Fukushima fuel melt problems a couple months back, those were disturbing enough, but perfectly predictable.  The problem stems from the review of their power generation options.

The Japanese are in a tough position.  Fortress Japan is wonderfully isolated by water from all human attackers, sort of like Fortress America. This made it a good place to form a coherent society.   But, unlike FA, FJ has no abundant natural resource to power a modern civilization.  No uranium for their reactors.

JapanReactor_map

21 sites hold 51 Reactors

Currently, they have a thriving society based on 21 sites holding 51 power reactors that supply an average of 30% of their power needs.

I show the reactor sites on this map (base map from Wikipedia Commons as shown).  There are 2 sites marked by × where the reactors are not yet operational.

The WNA states that when 2011 began, the plan was to have an additional 50 reactors operational by 2030.   These were to produce 50% of the total electric power needed.

The numbing result of our Nuclear Decisions-2 was that the current style of reactors (pressurized water, boiling water and liquid metal fast neutron types) promise many unhappy core melts to come.  These things occur in chaotic conjunction of multiple unplanned disasters.  (Example: Mag 9 earthquake + tsunami.  Or, think of sleepy, bored control room operators with repaired valves installed almost correctly; then add the burst of a corroded water conduit burst.  Things like that.).   Nuclear Decisions-3 indicated that the once-through procedure that generates spent fuel rods is a prescription for long term disaster.   Nuclear Decisions-4 showed that the world  does not contain enough uranium ore to let countries replace hydrocarbon fuel with nuclear.  There may be solutions, but using business-as-usual technologies will not work.

Every reactor in Japan will need refueling maintenance during the coming 12 months.  The hope was to put the unit in safe mode at that maintenance time and close the doors. This puts an end to the 50 new units and essentially an end to Japanese reliance on nuclear power.   In one year all plants would go “dark.”

I have to applaud the Japanese decisions.  But, as Reuters points out (see lead link),  the timescale is devastating.

Reactors generate 30% of Japanese electricity that powers the industry that pays the workers who pay the taxes.  Conventional plants could makeup no more that 60% of that loss. And that is if they all run FULL out, a non-optimum situation leading to certain early equipment failure.   Quick calculation — 60% of 30% total is 18%, leaving a shortfall of about 12% in current power capability.

Suppose that, for safety, they power down all reactors tomorrow. The day after would be economically disastrous.  Japanese industries are threatening to pull out of Japan altogether and head for undisclosed locations that can power their machinery.

Suppose you were a Japanese leader: How would you make the power decision?  Liquified natural gas?  This has almost the energy density of gasoline and would help.  But does Japan have sea port space to handle the shipments?  They certainly do not have the plants standing ready to start burning natural gas.  This is a 5 year solution, if they waive all regulations and just push for the goal.  The same argument is made for all potential fuels.  Logistics do not exist and the hardware infrastructure would not be available for years.

SolaArry_img

Molten salt solar heat uses array of mirrors

Solar?  There are several prototype huge solar power generators being built, let’s scale from the Torresol plant in Spain. This will generate 20 MW using a plot of mirrors covering 185 hectares of land.  185 ha = 1.85 km2 = 0.714 miles2 for 20 MW.  Use 0.093 km2  per MW generated.    According the the U.S. EIA, Japan used 964 G kWh of electrical power in 2008 (last year reporting).  30% of this is to be replaced by solar.    Solar must generate 0.3× 970 GkWh in one year (= 24×365 = 8760 hours)  or  0.3×970×109 kWh/8760  = 33 M kW = 33,000 MW of power, approximately.  Room needed: (33 000 × 0.093 =) 3 100 km2 for the solar generator system.  The Torresol plant stores excess energy in underground molten salt tanks and can continue generation for more that 15 hours after the sun sets.   I do not know the ratio of peak demand to average demand but I would think it might be  a factor of 3.   This puts the land need at 9 000 km2.

Japan could put the solar facility on a square of land 95 km (59 mi) on a side to generate the needed power.  This would not be located in a single place, but it gives an idea.  Concept is “back of the envelope” feasible.  They could probably do solar to replace the current nuclear, if they wanted to live with occasional brown down times when the sun has been MIA for 24 hours or so.

Wind?  They could do wind, too.  Japan is all coast and have great gusts.  But wind power is noisy and kills birds.  Maybe off shore?   All this is definitely at the prototype level of development, do not pin your country’s future on such.  If they started today, my quick guess is 10 years to full implementation, solar or wind.

click for LastTechAge on fission technology

This is not just an idle exercise.  They must do something, and they do not want to be the Future’s nuclear disaster theme park.   I do not see a quick fix and my recommendation would be to do a bit of each.  LNG will become very expensive when oil is no longer holding hydrocarbon costs down,  so this should be only a fraction of the solution.  Coal is truly dirty with many poisons released in its burning.  Read expensive to mount effective pollution controls.   Think about what you would do if you were the Emperor of Japan …  someone is.

Charles J. Armentrout, Ann Arbor
2011 Jun 9
Listed under   Technology    …   Technology > Fission
Have a comment? Click on the title of this post, go to bottom, let us know.
Related posts: Click the INDEX button under the Banner picture

Posted in Technology | Tagged , , , , , , | Leave a comment

Are Strategic Oil Reserves obsolete?

The Strategic Petroleum Reserve (SPR) is a pool of crude oil that we squirreled away over the years, to help us out in time of crisis.

OilPump_imgRecently, President Obama suggested that some of this resource might be used to help out our consumer public in their awful stress with high gasoline prices.

Just how important is the SPR, anyway?   Is the SPR  political candy, to be popped into voters mouths when they become squirmy?  Or, shall we combat threats of recurring rises in international oil prices by  flooding the markets with a gusher of oil  (if done, would pricing return to its proper $40/bbl)?  … Or  what exactly?
(1 bbl is one barrel of oil;  exactly 42 US gallons, or to within 0.008 %,  159 liters. )

ChinaSPR_img

2009 map of SPR, China (China Daily)

National SPR sites exist all around the world,  for example, Australia, China and India each operate at least one. Most were built to supply military needs in times of stress.   Although the US has the largest reserve in the world, it seems that there is little national consensus about its reason for existence.


I never paid much attention to our SPR.   It was authorized by the Energy Policy and Conservation Act (EPCA) of 1975 as a backlash to the Saudi oil embargo and required many decades to fill.  A discussion of the facility is in  A1 Background.

I thought it had to do with military security, sort of like Eisenhower’s authorization of the interstate system for troop mobility during wartime.  There was little word about it until it supported hurricane recovery in the 2000’s.  Now, gasoline prices are rising again and the Obama is considering spending it to make things a bit more comfy.  Is the SPR worthwhile, or should we convert init to cash as quickly as possible?

Current situation:  We have 726 M bbl in our reserve, 159M m3.  How and when should we spend it?   My graph, below,  is drawn from data taken at the SPR website, shown.

SPRgrowth_gph

Timeline for growth


Several points become clear.  The SPR was steadily filled though the end of Pres Reagan’s years.  In 1991, it was used to support our military excursion into Kuwait. The level wiggled, actually fell during the business-oriented Pres Clinton years  due to 2 political drawdowns.  Pres Bush-2 held it in benign neglect until the 9-11 terrorist attacks in 2001.   It was brought to full fill level by the end of 2009.  It had sufficient resources to be of help during the natural disasters of the 2000’s.  The formal procedures to fill and withdraw are in A2- Rules.

What’s it all about?  There are two numbers that are important to our SPR:  it stores 727 M bbl, and it can release oil at 4.4 M bbl/day.  Note, capacity is authorized to 1 G bbl.

Use_tblFrom the table (data from the EIA), the SPR holds about 10% of our current annual usage.
727/7000= 0.104  ≈  10%.

In the event of an aggressive embargo, the SPR could supply (3.7 Gbbl)/(7.0 Gbbl) or about 53% of annual import need.  That is, it could supply about 193 d of crude to our refineries, if provided at needed rates.

On the other hand, we could only supply (4.4 Mbbl/d)/(10.27 Mbbl/d)  ≈ 43% of current inflow.  The best we could do is to withdraw oil at the SPR maximum  rate (not the needed rate of last paragraph) and maintain that rate until the wells made empty-bottle sucking sounds.  We could keep this up for about 5.5 months:   (727/4.4) = 165 days, almost 5.5 mo.

Final Assessment of current capability:   The Strategic Petroleum Reserve is capable of supplying 43% of our current daily need  for about 5.5 months.

Final Assessment if capacity increased to 1 Billion bbl:   If all storage cavities were drained in parallel, the withdraw rate would increase to about 6.0 M bbl/d.  This would provide oil at 58% of our current daily need for about 5.5 months ( 1000/6 = 167 days ).

If we faced such an embargo, it would be warfare conditions and the reserves would be rationed for essential services;  it would last much longer.

End Note

Some countries are building petroleum reservoirs for military use.  Our Reserves are meant to keep society together.  This  is a valid reason for existence and should not be wasted.  Even if we never have another war (bets, anyone?), it is a huge protection against acts of nature. The drawdown of the last century to support invasion was pretty clearly illegal.  There is nothing that says that the President may authorize an emergency Finding to support an invasion.  Our military are on their own, I am certain that this has occurred to the Chiefs of Staff before now.

BryanMnd_img

BryanMound SPR facility

If we were to use the SPR in an attempt to drop the price of oil, it would have not much effect, because oil producing countries could reduce their own output to drive the prices back up.  Such an effort by our President would be ineffective at best, and  possibly a violation of the EPCA-1975  (only the Supreme Court could decide that).

The last paragraph assumes that our oil supply is boundless.  Although we will not know until as much as 10 years after the event,  we are at least close to the peak in world oil production.  It is nearly certain that the rise in gasoline prices is due to peak oil situations rather than massive human greed.  It was purchased when prices were much lower  and would be impossible to replace at the that price. (India announced halting its SPR purchases because of the steep cost increases.)

If President Obama were to release oil onto the market (as he is considering), he would waste a resource that will be hard (or impossible) to replenish.  Oil production-peaking will skyrocket its price;  global warming will release energy for violent events – ones that demand emergency intervention.  We note that some in Congress have called for  ending  the program (the hyperlink is to a call to stop the final  part of the reservoir fill).

click for all our discussions about oil resources

The SPR is not obsolete, it is among our most precious national possessions. We should be considering protecting and expanding the emergency oil reserve, not terminating it.

What should we do?

  • Let congress know that the SPR is for emergency use only, trivial withdrawals would waste it and make it unavailable when truly needed.  We should keep it in its fully filled state.
  • Expand the SPR system to the full 1 billion barrels as authorized, then fill it.

The Strategic Petroleum Reserve is a huge asset.  We must accept this truth , if our part of this last technical society is to continue to endure.

—————

Charles J. Armentrout, Ann Arbor
2011 Jun 7
Have a comment? Click on the title of this post, go to bottom, let us know.
Listed under   Natural Resources    …thread  Natural Resources > Oil
Related posts: Click the INDEX button under the Banner picture

==============================================

A1: Background – Strategic Petroleum Reserves 

SPR_map

Four sites make up the U.S. SPR

This reserve was first proposed in 1944 as a massive military dump for  refined-fuel,  but was not authorized until after the oil embargo or 1973.   President Ford signed the Energy Policy and Conservation Act of 1975 and filling began in 1977.  Originally,  the Reserve was authorized with a final capacity of one giga barrel (159 M m3).     (1 G bbl = 109 bbl = 1,000,000,000 bbl)

One site ultimately developed leakage and was abandoned in 1996.  Current capacity is 727 M bbl (115 M m3 ) from 62 chambers spread about 4 separate sites.

System   The SPR reached full capacity in December of 2009.  The oil has been paid for by a program begun in 1999,  the Royalty In Kind (RIK) program (see next Appendix).  With RIK, the reserve fill cost did not impact on the federal budget.  To date, we have spent 5 G$ on facilities and 17 G$ on oil, for total expenditure of 22 G$.

This works out to a net cost of $30.26/bbl for our 727 M bbl reserve.  BTW, this is a great price for the oil.

FYI:
Flow start
: 13 days after a Presidential Finding.
Flow rate: 4.4 M bbl/day maximum. This max has never been tested.

Cavuity_Dgm

Salt dome cavity

How to make your own reserve:  The SPR consists of 62 caverns that were leached milled from solid underground salt deposits. First salt deposit was drilled into, then clean water was injected into the volume and  dissolved salt. The resulting brine was removed from the growing cavity.

After sufficient time, an approximately cylindrical chamber 200 (dia) by 2000 feet was formed.  Oil is pumped in and the remaining brine removed.  Note:  oil will not leach salt, it is trapped in cavity.

Dealing with cavities in salt domes has been a learning experience; for example, it is now known that abandoned salt mines are not good for seepage-free storage.  (The Week’s Island facility was an old salt mine and  had to be closed in 1996.)

Once stored in the cavity, how should it be removed?  One way is to inject water and push it out. Unfortunately, this causes renewed leaching of the salt and an uncontrolled enlargement of the cavity.  Neither the dome nor the cavity is geometrically regular and the leaching will expand in unexpected directions.  It could cross the boundary, and allow future oil storage to escape into the surrounding earth matrix.    Back

——————————————————–

A2:  Rules of engagement – When can withdrawals be made?

BryanMound_img

SPR facilitiy at Bryan Mound TX

The Energy Policy and Conservation Act of 1975  (EPCA) was submitted by Sen.  Skip Jackson (D-WA) with 13 co-spons0rs;  President Ford it signed into law by the end of that year.

The EPCA was a direct response to the Arab Oil Embargo (1972 – 73) and set up a framework to mitigate the impact of future embargoes. Among its provisions were the first automotive fuel economy standards, and the ground rules for a strategic oil reserve.

The following is my summary of the provisions, based on a number of analyses, one of which is from the Department Of Energy.

Bighill_img

SPR at BigHill site

SPR Buildup:  Petroleum may be acquired by 3 methods
A Purchase  …

Volume of oil purchased at current market value.  Most of the oil has been acquired this way

B  Exchange  …

Volume of oil provided up front for repay by  larger volume of oil (of equal or better quality) at later date.

C  Royalty In Kind  …

Transfer of oil to SPR as payment for leasing rights in the Gulf of Mexico.  Amount of levy  in range of 2.5% to 16.7% of production. Volume to be valued at current market prices.  RIK started in 1999, was highly controversial during operation, and was ended in 2009.  Much of the final several hundred million bbls was obtained this way.

SPR Drawdown:  Petroleum may be withdrawn by one of 3 methods.
A President issues Finding  …    [EPCA, Sect 161(h)]
> of significant shortage in the National energy supply
    –     Finding based on 3 factors  [EPCA, Sect 3(8)]

  1. Significant scope and duration of emergency:
    not to exceed 30 M bbl reduction, 60 day duration
  2. Shortage might have adverse impact on National economy
  3. Shortage is, or expected to be, result of interruption
    of supply:  sabotage or Act of God

Point one is as shown.  This  must place limits on the amount of response to an emergency; it cannot mean emergency withdrawal is ok if there is a 20 M bbl oil shortage, but must be  ignored if the shortage is 50M bbl shortage.

B  President issues Finding  …   [EPCA, Sect 161(d)]
    >  of  severe interruption in National energy supply,   or
    >  of  “obligations under  International Energy Program”
    –     Finding based on 3 factors 

  1. The country is in an emergency situation involving
    significant reduction in supply with significant scope
    and duration,  as under Point A, Shortage. [Sect 3(8)]
  2. Severe price increase has resulted from interruption
  3. Result of B will, or will likely, cause “major adverse
    impact on National economy”

2 and 3 are based on section 161(d) of the EPCA.

C  Test Sale …    [EPCA, Sect 161(g)]
–     Decision by Secretary of Energy
–     Amount not to exceed  5 M bbl

Conclusion 1:  SPR is not for national security.  There are no provisions for a Presidential Finding on using the petroleum to support a war effort.   This was clearly meant to be a mechanism to keep society operating for a short time.  One must guess that the various military services have their own strategic supplies.

Slide_img

SPR is not a marketplace tool

Conclusion 2:  SPR is not a tool to control the market.

This slide is from a 2007 presentation at an International Energy Association meeting by Dr. Jim Hart of the U.S. DOE.
Click the image to see larger version
.

These two points are a nice overview of the legal status of the of this appendix. Back
___________________________

Posted in Natural Resources | Tagged , , , | Leave a comment

Is there enough Uranium ore to do the job?

In a recent post, Nuclear Decisions-4, we examined whether nuclear power might be able to replace all other forms of power generation.  Our answer?   No, we will run out of fuel immediately we were to try.

That answer assumes we continue current US  once-through policy – Sequester the fuel after it has been in a reactor and has generated enough reaction poisons to halt fission activity.  The grand idea is that we will put it somewhere inaccessible by humans for the next million years.

Let’s reconsider nuclear applications with a fresh viewpoint.   If we cannot replace ALL power generation, is there any fuel we could replace with uranium?

Uranium stores more energy-per-kilogram than in any other fuel


Table 1 is our chart on the energy richness of different fuels.  Footnote [1] discusses assumptions behind this table.

FuelEnergyComps_tbl
Fig 1 Uranium holds by far the most energy

Uranium is clearly much richer in energy than oil or any other fuel source. So we naturally ask: The other fuels are running out, or have pollution issues … could we substitute uranium for these and alleviate the problem?

Probable lifetime of uranium reserve, TU = 230 years.

NatU-Rsrv_tbl

Fig 2: Est lifetime of world NatU reserves

In the Annex (down below),  uranium industry data shows that the world currently uses about 71,000 t of natural uranium each year, and the EIA  [2]  says we generate 2.6 T kWh (trillion kiloWatt hours, a.k.a tera kiloWatt hours) annually.  Based on the RAR (Reasonably Assured Resource) of 5.4 Mt (mega tons) of natural uranium, we expect natural U to last 76 years if used at its current rate (constant, no change over the lifetime).

Most people in the industry would multiply the RAR by 2 or 3.  The current low prospecting level for  uranium will go up when positive returns on investment happen;  people expect large increases in potential mining sites when proper geological surveys are conducted.

If the uranium demand is to triple the amount expected ore,  the probable lifetime of mineable resources will be nearly 230 yrs.

We will use the basic 76 year value for our Expected values.  We stretch each answer by 3 for the Probable value.

Replace petroleum energy by nuclear?

Society has either reached the end of exponential increases in petroleum products, or is very close to that peak point.  Ever-increasing demand will NOT be met in the future.  This paints a grim vision of ever-increasing prices for the same (or decreasing amounts) of oil.  Ready cameras  Scene-I backstory:  crashing economies, raging wars, diseased and poverty-stricken masses,  small enclaves of ultra rich trying to stay comfortable.

Petrol-NatU_tbl

Fig 3: NatU lifetime if it replaced oil

Petroleum data:   World consumption 2010 [3]:  84.5 M bl/d,  30.7 G bl/y. Energy generated: 178 Quads (quadrillion BTU aka  1015 BTU), or 52.2 T kWh  per year.

Nuclear option:    If nuclear were to take over the petroleum supply,  it must annually supply the petroleum energy, in addition to the  amount it currently  generates.  For a reserve of a fixed size,  Usage × Lifetime is constant.  Use more, the reserve lasts less,

54.8 * T = 2.6*76 …  Right side: Fig 1, Left side, new total energy × lifetime petroleum replacement, Right side is current nuclear usage

Petroleum Answer:  The probable lifetime is 11 yr.  No, nuclear resources are not an alternative for petroleum.  One decade to resource exhaustion would not be sufficient gain for the price we must pay to … build reactors, operate them safely, decommission  them after natural U is gone, and then finding  guaranteed safe storage for the waste.

Replace coal energy by nuclear?

Coal is very destructive to the environment.  Cities that use it have terrible smog.  Currently burning releases 6 billion tons(6 Gt) into the atmosphere and is a strong driver of the greenhouse effects. Temperatures are indeed rising, releasing more free energy into the atmosphere; causing more chaotic swings in environmental turbulence.  We really could use an alternative to burning our several hundred year coal reserve, especially high sulfur coal.  Could we do this with the nuclear option?

Fig 4: NatU lifetime if it replaces coal

Fig 4: NatU lifetime if it replaced coal

Coal data:   World consumption [4]: In 2009, world use was 7  M t of coal,  143 Quads of energy, corresponding to 42 T kWh in energy.  This is a very rough estimate because of huge variation in thermal energy in the various kinds of coal.

Following oil replacement ideas, 44.6 * t = 2.6*76. Expected NatU lifetime = 4.4 yrs.

Coal Answer:  No, Nuclear power is not an option to replace coal use.  One and a half   decades to resource exhaustion would not be sufficient gain for the price we must pay.  If every country decided to do this, the reserve would drain and resource wars would be probable..

Final comments

Analysis of our four previous Decision posts, indicated at least these 3 points:

  • The power generating reactors around the world are a real and present threat.
  • Fuel melt down incidents need not be inevitable.  We never need watch another one happen.  We could have built intrinsically safe reactors decades ago.
  • Sequestration strategies can not be trusted.  The time frame for safe-keep is well beyond our ability to predict.  Failed sequestration will have fatal consequences.

Our point here is that, as energy-rich as uranium may be, it can not make up for the failing energy sources that society depends on.  We are blocked from success by our once-through rule.  The root cause behind this rule is not a technical issue, but a social one: Governments do not believe they can control the overseers who gain financially from nuclear power.  This is a sad truth; because of it, we did not adopt reactors that are intrinsic safety and burn “waste” fuel.

The once-through rule plus operating reactors form the worse case scenario.  Reactor disasters will continue to occur throughout this century.  As our petroleum base becomes ever more expensive, each new incident will be harder to contain that its predecessor.  If we do not act (and soon), the present system will crumble in its weakest spots, and society at year 2100 will be significantly degraded.

All our estimates of limited uranium resources become moot if we can burn the “waste” fuel for energy; they become meaningless if we learn to safely breed fuel.  With a rich source of power to build on, we can develop maintainable lifestyles  – decent food, good medical treatment, well-paying jobs that allow us to live with pride.

This requires we build reprocessing plants to supply the new type of intrinsically safe gas cooled reactors. These new plants must be government-run and military guarded. This can work, we did this after WW-II with the National Laboratories that handles nuclear weapons information.

I admit to a bit of discomfort with this statement, probably due to personal decisions made long ago.  I decided to study plasma physics and fusion technology rather than nuclear physics and reactor technology partly from my personal distrust of the fission power politics  …but… The bedrock of hard fact remains: we cannot sustain ourselves as a society without a rich energy resource to draw on.  Fusion was abandoned, fission remains the only viable source that can support energy intense activities such as manufacturing and mining.

And we can do the job. We can extend existing nuclear options until sea water is an economic reality.  There is yet a path to a secure, sustainable and comfortable future based on the astonishing technical achievements we have made collectively during the last several thousand years.

click for LastTechAge on fission technology

We could, but we must make the decision soon. Indecision is a decision for the downward path.  Decisions to extend the status quo, even by massive amounts, would drain irreplaceable resources into inadequate (current) solutions; it would only enrich vested interests.  This this would  enhance our decline, not our future. Do we in the US have the will?  Do we in the US, Canada and Europe have the will?  Do we in…
——————–
Charles J. Armentrout, Ann Arbor
May 29, 2011, Update 2013 Apr 10, added tables
Listed under    Technology     …   Technology > Fission
Have a comment? Click on the title of this post, go to bottom, let us know.

Related posts: Click the INDEX button under the Banner picture

—————————————————————————————————————————

Annex:  Available Uranium


Previous estimate.   In Nuclear Decisions-4, we followed the lead of an  estimate for uranium that was published in the  popular science magazine, Scientific American [5].  Three parameters were needed:

natU-LEU-HEU

Fig 1 – Uranium enrichment classes

  1. World energy use [6]
    (2.8 T kWh/yr),
  2. Power generated by LEU
    (1 t LEU produces 400 M kWh)
  3. Amount of natU needed to make LEU (10 kg natU per kg LEU).

These were sourced back to the US Department of Energy’s Energy Information Agency.  Note: T means million×million, pronounced as  “tera”  (international standards) or “trillion” (US convention).  Results – the world uses about 70,000 t of uranium each year and if we multiply the known reserves by 3 to account for undiscovered resources,  we calculate a 260 year supply in the uranium reservoir.

We will not distinguish between metric and English tons because they differ by only  10% and our estimates will certainly be no better than 10-20% of the exact value.

UraniumMap_img

Fig 2–  Top 10 Uranium mining countries

Second estimate: Same question from economic viewpoint.  Uranium occurs in nearly everything [7],  with 2.8 ppM average concentration in the soil and 3 ppBillion in sea water (about 500 M tons of U).  This is so dilute that the huge majority of it is not obtainable in any cost effective way.  This differs from petroleum which exists in well defined pools.


Mineable deposits of U do exist and Fig 2 shows that the top three reserves are in Australia(31%), Kazakhstan (12%)  and Canada (9%) [8].  The US  has about 4% of the known deposits. Kazakhstan is the leading ore producer. The result of extracting natU from ore is a yellow powder compound, called yellowcake.

Fig 3 –Ore classifications

A few mines have U at concentrations of about 10% (1 kg U per 10 kg ore) or more, but most are much less.  Fig 3 shows ore classifications, which is done by concentration, which extend between 0.01% (1 kg natU per 10 tons of ore) and 10%.  On this kind of log graph, the width of the decades are the same, but steps shrink as they move up from 1 to 9.  The average is about 0.15% (1.5 kg natU per ton of ore). The kind of matrix also matters, from soft sandstone (cheap to extract) to hard granite (expensive to extract).


If concentrations are below 0.01:  (A) the ore is  uneconomical to mine, and, (B) it would be better to use the extraction fuel carbon-based to generate energy because it would produce less CO2  per kWh than would be emitted by processing the uranium needed to generate the same amount of kWh [9].

U-SupplyDemand_gph

Fig 4– Demand has exceeded supply since Chernobyl


All of this is relevant to estimates of how much natU exists in usable concentrations.  Although there is a lot at low concentrations,  for power generation, we will extract only that which gives a positive return on investment.  Fig 4  shows the relationships between supply and demand for uranium [10].  Supply is controlled by the cost of exploration, mining operations  and natU extraction;  demand is controlled by the number of users who want it.  Two demand curves are shown, one is for the power generation industry and the other is said to include naval uses.

Total world-wide demand is about 71 kt / year.  This is from Fig 4.  It is interesting to note that supply only contributed 54 kt of natU.  Currently, the difference is being made up from military stock, mostly from the former Soviet Union states that are dismantling their atomic weapons supply and selling a mix of  plutonium and depleted uranium left over from the enrichment process.  The result is MOX, discussed in Decisions-4 and usable in most light water reactors.  International agreements on this end in 2013, and mining must make up the natU difference.

U-prices_grph

Fig 5 – Uranium prices years starting 2006

Uranium prices rose as the reality of disappearing cheap oil began to impinge, Fig 5 show spot price history.  The power industry renewed exploration and began application of truly dirty mining techniques.  This price trend has an impact on estimates of uranium reserves.

World proven reserves amount to 5.4 Mt of uranium.  [11]   This is the Reasonably Assured Resource (RAR) value for when the selling  prices is US$ 130/kg.  The situation is slightly different than that for petroleum, where the oil is found only in well defined pools.  Since uranium exists in almost all types of rock throughout the world, the RAR always must be tied to the selling price, not to an estimate of a finite number of pools.  In 2007, we saw estimates of 6.3 Mt, but check the US$/kg levels of Fig 5.

There is a twist, however, that I have not seen discussed. Several things must be happening right now. Refer to the discussion between Figs 3 and 4, above. As easy petroleum disappears and the price of oil rises and the “front end” enrichment costs of extraction must be going up fast. This would have a negative effect, but uranium produces much more power kg for kg than oil and the value of finished LEU will increase as the petroleum supply decreases. [Ok, here is what happens— At peak oil, we will not see a reduction in the barrels of oil available, but we will see the loss of ability to meet the relentless growth in energy demand. This will cause a premium to appear on electric power, one that uranium based sources almost certainly will try to fill, CO2 be damned.]

Estimates in Uranium Reservoir Lifetime – 76 years.

Assume that the enriched and processed uranium is once in a reactor. When fission products build high enough to poison the reactions, that fuel is removed and sent to sequestration, a limbo existence for the next million years.

Lifetime for reserve TU = (5.4 Mt available) / (71 kt/yr use) = 76 years. This is close to the  value given in the literature [12, 13].

Will this get bigger?  Yes, when prospecting efforts return to earlier levels.  There is a lower limit to usable ore concentration in the soil because extraction becomes too expensive and generates too much CO2 to justify.  There has been an interesting scientific study in Japan in filtering natU from sea water, but this is truly at the level of an enjoyable experiment or a very early prototype.   Sea water extraction may actually become feasible, but as with most things, once engineering realities hit, financial and environmental impacts will shoot up.  This has happened in almost all industries.  Atomic power, fusion power, superconductivity cables, fiber optic transmission lines, space exploration –   none of  the big technologies are home runs, they have all proven to be real  challenges.

—————————————————————————————————————————

Footnotes:
[1]  This table combines data taken from a number of sources, including:

http://www.shec-labs.com/calc/fuel_energy_equivalence.php,
http://www.whatisnuclear.com/articles/nucenergy.html,
http://cogeneration.net/fuel-and-energy-conversion-and-equivalence/,
• link for fuel equivalents removed by request  2014 Aug 25
http://en.wikipedia.org/wiki/Energy_density

There are a number of grades of coal and wood which makes any standardized comparison difficult.  Uranium energy might mean fissile 235U,  or any of the possible enrichment levels of LEU ( anywhere in 3 to5%).  It could mean the natural U, U3O8, (yellowcake) found in ore with reported energy content scaled for use in LEU.  Or it could be natural U with much larger energy reported as when used in a CANDU class reactor.

The last row in our Table 1 is for  light water reactor grade fuel enriched to 4.3% in 235U.  It makes sense to compare fuels to the natural uranium (natU or NU) which is the material that is mined, not LEU, since all reserves are listed for yellow cake mining and extraction. We are not really concerned with the reactor capability, just the natural uranium in ore.   Return

[2] EIA-nuclear.  EIA is the US governments source of energy-related data.  Return

[3]  Petroleum usage:   EIA-petroleumReturn

[4]  Coal usage:   EIA-Coal. Return

[5]  Steve Fetter, “How long with the world’s uranium supplies last” Scientific American, March 2009.  The version referred to here was the on-line response. published  January 26, 2009. Return

[6]  World usage in kWh energy units is from  EIA  but at a slightly lower value than in [5]. Return

[7]  Much of the data for this post comes from the World Nuclear Association, an activity coordinator with most of the nuclear-capable counties as members. WNA-Inf75.   List of WNA resources.   Return

[8]  WNA-inf75 .     Return

[9]  David Flemming’s Lean Guide, especially Sect. 2, p8.  Also see Oxford Research Group, Jan Willem Storm van Leeuwen’s Energy from Uranium Sect 4 for costs and later for ore grades.   Return

[10]  Supply and demand is in many sources. Here is source from World Nuclear Association WNA-inf23Return

[11]  Reservoir estimates at  U-mining.   The IAEA estimates that at the start of 2009, RAR = 6.3 million t for a price of US$300/kgReturn

[12]   The Nuclear Energy Agency (NEA) is a specialised agency within the Organisation for Economic Co-operation and Development (OECD), an intergovernmental organisation of industrialised countries, based in Paris, France.    The NEA publishes (for free download) the discussion, Nuclear Energy Today   The OECD’s “Red Book” may be the best source on the quantity and quality of the remaining uranium ore, and of future prospects for production. Return

[13]  A good, short source to see the issues: The Lean Guide to Nuclear Energy, by David Flemming.  Return

Posted in Technology | Tagged , , , , , , , , , , , , , | 6 Comments

Has Peak Oil happened?

The 2011 March 25  s article by Richard Kerr in the the professional journal, Science1 discussed the possibility that the peaking in  world petroleum consumption may have already occurred.  (Richard A. Kerr, “Peak Oil Production May Already Be Here,” Science, vol 331, 25 Mar 2011, pp 1501-1511.)

Richard A. Kerr

Richard A. Kerr

The 2011 report is a follow-on to Kerr’s earlier earlier discussion ( Richard A. Kerr, “Bumpy Road Ahead For World’s Oil,” Science, vol 310, 18 Nov 2005, pp 1106-1108.) where he noted that several petroleum production scenarios were projected, each with a different growth rate, and each indicating that oil production would peak, but at slightly different times.  The 2005 article said that the most probable time for a Hubbert-style peak was at least 10 years in the 2005 future.

In his recent update, Kerr states that these experts may have been too  optimistic, it is very likely that non-OPEC production has probably peaked already.

We have discussed this a lot: Our  Patterns in World Oil Production presents evidence from a number of world oil producing nations.  Saudi Peak Oil discusses the swirl of evidence that the deep wells in Saudi Arabia are at the start of the peak oil scenario:

  • That the fields have been 1/2 drained
  • That continued extraction will be done with ever more expensive techniques
  • That the field will not be able to supply oil at an ever-increasing rate.

This is what is meant by  the phrase “peak oil.”  The Saudi’s appear to have lost capability to meet ever increasing  world demand.  LastTechAge has also discussed studies that indicate world copper reserves may be only a couple decades from “peak” production.

click for all our discussions about oil resources

In  Lynch Poo-Poo, we examined the comments by one of the  old-time peak oil nay-sayers.

Richard Kerr’s reports are very interesting.  I think that we will be able to see peaking only after a number of years have passed and the political and financial oscillations have passed.  So, we are playing a reality game, and only time will tell the winner.2

Charles J. Armentrout, Ann Arbor
2011 May 16, Current Update: 2014 April
Listed under   Natural Resources     …thread   Natural Resources  > Oil
Have a comment? Click on the title of this post, go to bottom, let us know.
Related posts: Click the INDEX  button under the Banner picture

————————————————————————————
1  Science is a journal for working scientists, with sometimes arcane research reports. It excels, however, with first class coverage of science news.  see www.sciencemag.org

2    Growth path for any system:

  1. A startup usually begins with few external constraints to beat it back – think of the original Rabbit Growth released into fertile Australia, a drop of bacteria in a large nutrient-rich petri dish, or ignition of an explosive. The initial process expands with a constant growth rate, that is it increases proportional to the total amount removed present –  this is “exponential” growth.
  2. Peak growth happens when the system has become large enough for outside reality (external constraints) to interfere with ever-increasing growth: The rabbits eating all the spare vegetation, the bacteria run out of nutrient, etc.
  3. Mature systems are what exists after step 2.  Mature systems follow their own path that are frequently dominated by economics and current politics; but they cannot expand by amounts proportional to the current amount.  End-game scenarios try to make predictions about this; accuracies are constrained by the probabilistic nature of all discussions of future events.
Posted in Natural Resources | Tagged , , , | Leave a comment

Nuclear Decisions 4 – What does it all mean?

The world is in the middle of a crisis concerning nuclear energy.  Fukushima, reprocessing breaches, loss of coolant, fuel melts, release of radioactives into the environment – a host of nuclear hobgoblins beat about our heads, screech our ears. Are there sensible solutions?

I believe the answer is yes – we could, should we so choose, have nuclear power generation that provides for safety in as much as there is safety in anything.

This is the 4th and final entry in this present chain posts.
To skip over the expanded review of the issues, click here.
To skip to the  final conclusions, click here.

Addendum:  2011 May 25.  Matthew Wald published an article in the New York Times today discussing storage of spent fuel, the principal topic for our current post this post.  There is a good map of US reactors and the amount of stored radioactives at each.  This is an article on a report by Robert  Alvarez of the Institute for Policy Studies where it is available as a PDF, also a 1 page Fact Sheet in PDF format.  This set of reports fully support the analysis presented here.

The issues

FukushimaU1_img

Fukushima Unit 1 — afterwards

Decisions-1 covered the sorry history of nuclear accidents and identified loss of coolant and waste storage as the main events that lead to environmental disruption, or worse.

Although bad events have happened during reactor operations, none have  ever degenerated into a worst-case incident. We are lucky that our known incidents have only been very close misses.  Even the fuel melt at Chernobyl was not as bad as it could have  been.

• Loss of coolant and fuel melt issues were considered in Decisions-2. This top (superficial) level review pointed out that for more than 4 decades, designs of intrinsically safe reactors have been available.  A high temperature helium cooled reactor is self stabilizing to LOCA events; it would naturally park itself at a safe operating point  if something interfered with the flow of the cooling gas.

AP1000_dwg

Gen III Westinghouse PWR – highly simplified

Reactor design is currently undergoing re-analysis with the proposed Generation III reactors, expected to start coming on line about 2015. Most of these are safer forms of our same old boiling water and pressurized water reactors, using highly simplified control design and special passive mechanisms in an attempt to make the  active controls more reliable. See Gen-III.  Units like the French Areva’s EPR or the Westinghouse AP1000 are examples.

It is too easy to imagine failure modes – what if multiple things go wrong (a la Fukushima)?  These plants would be  safe against everything but the unexpected.

Even so, had the various corporate managements allowed,  these could have been proposed in the 1960’s when we were into nuclear construction;  the history of nuclear power might have been much more benign.

The Gen-III discussion website just mentioned compares reactor issued to a car wreck. Are they really similar? The thread through all my posts is that reactors generate a different class of incident. A car wreck might kill one or two families, but a reactor wreck might make Japan uninhabitable … to name a country at random.  Reactor incidents are low probability events with consequences that are transcendent to the merely awful ones.

Assessment:   Modifications to PWR and BWR designs are too little and much too late.

Many Gen-III proposals  are for throw-away reactors (use them up and ditch them).  These are mostly small generator modules (< 300MWe) meant for sites  (A) located away from the power grid,  (B) that have small but needed power demands,  (C) with many parallel units to provide high overall output power (GWe) with good reliability, or all three.   No one mentions what exactly will happen to the cores when they are dumped.  I suspect they do not plan to put these in some farmer’s ditch or in a municipal dump, but afterwards, what?

Assessment:   Throw-away reactors do not help the overall issue of long-term safety.

Gen-III also has proposals for at least two kinds of the high temperature helium cooled reactor, outgrowths of the 1970’s HTGR design.  These are  (A) the the gas cooled modules reactor with encapsulated fuel pellets loaded in graphite blocks (like the old HTGRs), and (B) the pebble bed which uses ping-pong sized fuel capsules that are inserted into the top of the funnel shaped core, flow down to the bottom drain port,  then out for reuse or replacement.

GTMHR_Dgm

GT-MHR Helium cooled modular high temperature turbine reactor

One of the (A) types is the GT-MHR designs (Gas Turbine Modular Helium Reactor).  The idea probably grows from General Atomics’ analysis of the success with its small Peach Bottom reactor and the issues that kept its large Fr. St. Vrain unit from full success.  These are proposed as clusters of small modules (250 MWe generators).  They would be highly cost competitive due to the high build-volume envisioned.  There is no inefficient intermediate coolant loop and the turbine is driven by the coolant at 850ºC; very high thermal efficiencies are expected.

Follow-on   Gen-IV designs are also being evaluated by a panel of  the 13 signatories to the Gen IV International Forum (GIF).  Machines from these deliberations might not enter service much before 2030.  these should be high efficiency naturally safe reactors.

Both Gen II (ended in the US in 1979) and Gen III (currently under construction) have designs that are intrinsically safe and cost effective.  Power company management and the NRC regulators  have just not bothered with them, yet.

No excuses:   Fuel melt due to loss of coolant accidents ought to be a thing of the past.

Fukashima SpentPoolU4_img

Debris in spent fuel pool (Unit 4) – afterwards

•  Fuel waste storage or disposal scenarios were examined in Decisions-3.  Fuel sequestration was identified as false security;  disposal techniques would probably work and include fusion or accelerator neutron generators for enhanced transmutation.

The most common “solution” is permanent immersion in continuously chilled and circulating water.  These are disasters waiting for release.

Fukushima, for example,  had over a million rods in its spent fuel storage pools when the tsunami and LOCA events occurred.  This is the background for the catastrophe that still unfolds as this is written.

Most reactor fuel pellets are enriched uranium with small ad-mixture of plutonium; These pellets become spent  (poisoned for fission) with 97% of the original fuel left intact.  Spent fuel rods are an attractive nuisance, sort of like putting poisoned candy out – If you leave it out, you might destroy more than pests.   There is a lot of usable stuff in spent rods which people must handle, move about, maybe reprocess.  Where there be humans, be there the threat of diversion.   So we have the double danger of release into the environment and diversion to terrorists.   Waste handling really is a tough issue.

There is nothing we can compare with a waste storage breaching problem;  it is an event without peer.  The handling of nuclear waste must be treated more rigorously than mining ore or pumping petroleum which might only cause severe local environmental damage and with only occasional widespread losses of life.

YuccaMtRidge_img

Yucca Mt, site for nuclear repository. Near Nevada Test Site

Sequestration is the top choice of many people and attractive methods have been proposed.

All fail either in the delivery phase (during transit to the sequestration location) or in the long term storage phase (during the 100 thousand to 10 million year interdiction period).

We must eradicate the threat.  Our only current choices are to use dirty chemical reprocessing (potential for diversion of  weapons grade material and environmental spills),  or to use fast breeder reactors (which have proven hugely dangerous and where, again, the material must be processed by humans), or to look seriously at transmutation schemes to burn nuclear waste into simpler atoms thereby cutting short the interment.

Decision-III argued that we must not choose sequestration.  We cannot obligate God to keep our poisons safe and must not expect nature to do so (too many zeros in the sequestration times).

What is it worth?

Look, kid, we’re aware of the problems besetting our society. We’re working on them.

The US chose the short term safety of not undertaking the danger of reprocessing techniques.  As of now, underground storage has proven to have unacceptable risks, refer t0 the Yucca Mountain discussion.

On May 13, 2011, the President’s review committee made the unwise decision to use above ground dry cask isolation and putting this at a site, yet unselected.

I really have only one question:  How do the manufacturers of these casks plan to reimburse the locals for leaks 100,000 years from now?1

How much natural Uranium are we discussing?

When asking how much waste must be sequestered, we have to ask: how much uranium can we find to use? This is like asking how much oil can I buy at 40 US$/bbl? (1 bbl is 1 barrel).  To answer the petroleum question, we are flat out of oil at that price.  The point is that the price of anything will rise as demand tries to exceed supply.  For a finite reservoir like the petroleum reserves, when about half the stored amount has been used, demand will outpace supply and cause very high prices, indeed.

Rising Demand::  In the last couple decades, China, India and others have been busy building their manufacturing economy, but especially their nuclear armaments.   The demand for U has risen dramatically just since the turn of this new century.

Fuel Data: Uranium occurs naturally  in the Earth’s crust as U3O8 (natU).   About 2/3 of a  percent of natU is 235U called fissile, because it fissions into smaller daughter products and releases a lot of energy.  For a fuel pellet, uranium must be separated from oxygen and 235U concentration enriched to a couple percent in concentration.  This is LEU, low enriched uranium.   The rest is 238U

Concentration Data:   NatU has a concentration of about 2.8 ppM, similar to tin and nearly 600× that of gold.  Some exists in mineable deposits and some is weakly diffused everywhere.  Bricks, stones, seawater … it is all around us.   Radon in people’s basements comes from radioactive decay of the U in cement and mortar.   Most would be hard to get and expensive to extract.   Consider the mine-able deposits.

PwrConv_tblMaterial Data:     The RAR  (Reasonable Assured Reserves  same as  proven reserves)  for natural Uranium is shown in the table for both 2005 and 2009.  Assumption: ultimately, we will have RAR =19 Mt.  We also see the 10:1 relationship between natural Uranium and low  enriched uranium, and the energy generated by that 1 t of LEU.

Mt means million metric tons.  We  drop the metric distinction because one metric ton only 10% more than one English ton.

kWh is kilo Watt hour.  Monthly home energy bills are stated these units.

PowerData_tblUsage Data:   Information for 2008 from U.S. EIA .  As a whole, the world  used 144 T kWh of electrical energy. Nuclear power contributed about 1.9% of that.  U.S. numbers are as shown, nuclear provided about 3.7%.

T means trillion (US) or tera (ISO).

How many tons of natU were required in 2008?

Ore = (2.8 T kWh/yr) · (1 t LEU/400 M kWh) · (10 t natU/t LEW) = 70,000 t natU/yr

How long will natU last at the 2008 rate but with RAR=19 M t?

Time at current usage rate =  19 M t /(0.07 M t/yr) = 270 years.

If you have read any of our Peak Oil posts, you will know that it is very likely that we are at the peak of oil production;  the world’s fields will not continue to match demand.  We need something to replace petroleum as the power source of choice.

Suppose we replace all power devices by rechargeable batteries.  No kerosene, gasoline, etc.  It makes sense to ask:  If we try to make up for petroleum loss by total reliance on uranium, how long would mineable resources last?

How long will natU last at the 2008 rate but with triple RAR?

Inverse relation:  If at 2% of total, the uranium will last 260 years, then increasing the fractional usage  must decrease the total lifetime of the ore deposits … fraction-used times lifetime is a constant number.   ( f T )A  =  ( f T )B  for any two rates A and B

Lifetime if sole power =  (fraction of total) × (Lifetime if at fraction)
0.019 × 270 y  =  (1) × T      … sole power means f = 1.
Lifetime of natural Uranium if sole source of power  T  =  5.1  years.

Shift to total nuclear dependance, use up natU ore in less than 5 years.

Conclusions

To summarize the results:  the  fuel melt  issue – We could build reactors safe from fuel meltdown, if we so choose.

The  nuclear waste issue –  storage, transmutation or reuse.  We have two options.

Assume no reuse of spent fuel:     We maintain current U.S. policy of sequestering spent fuel, or we decide to transmutate it to assure safety to our progeny.  We must recognize that mine-able fuel represents no more than 5 years of world energy supply.  Keeping our reactors running doing this is a truly stupid policy that just builds the future danger.  It is ridiculous to consider nuclear power to be worth continued build up of deadly residue if  availability is so short (nuclear needed for all power uses).

Under this set of rules, we should shift the investment in nuclear power into some other power source that can deliver much more than a 5 year reserve.

Oil is at the halfway depletion point, after 150 years after its beginning.  I would expect inexorable price rises over the coming years, accompanied by large fluctuations.  Even so, gasoline will be available at least another 20 to 50 years;  but will grow increasingly unaffordable, but it will be available.  This means we still have a short interval for smooth transition to another energy source.

Assume we decide to reuse the spent fuel:     The US policy whose idea originated  in 1957 and began implementation in 1976 (see previous posts) is wrong.  We must reuse the 97% good fuel we are throwing out, and invest in using other reactor technologies.  If we do this we could assure high levels of power for many hundreds of years (perhaps thousands).

This is not a call for a return to Fermi I, Dounreay, Phénix  or any of the other fast breeder reactors that were frightening and very dangerous.

  • The CANDU heavy water reactors can generate power using our current volume of spent fuel after some reprocessing.  This is demonstrated technology with decades of evolutionary development.  The history with India may indicate that it could be used to make weapons grade fuel, however.
  • Innovative Gen-III reactors like GT-HTR and PB-HTR designs are also “fast” units that are intrinsically safe.  These high temperature helium cooled reactors are also demonstrated successful technology.  The diversion capability is unclear with these units.

If governments are willing to provide secure facilities, these reactors are a stupendous opportunity for a massive extension of the reservoir lifetime.   General Atomics leads a consortium for small-module,  very high-efficiency reactors.  Because they use fast neutrons, they are able convert spent fuel into second generation fuel sources.  and other meterials such as thorium (which is more abundant than uranium).  This way, nuclear energy could last for more years than can be intelligently predicted.

Preferred waste disposal:  Even if we were to reject these as primary power plants (and begin the  closure of our nuclear plants), as waste burners, they still are superior to either accelerator or fusion neutron sources.

At The End

click for LastTechAge on fission technology

Those final paragraphs sound good, but I am very discouraged.  The cartoon says most of what I think, and in only 14 words.  We need charismatic leadership to take us to secure energy;  we had such to take us to the moon.  Nowhere do I see even one charismatic political or scientific leader to step forward.  Certainly not on the President’s Commission, which did only what it was told to do:  it suggested a “new” sequestration technique.

Here, as throughout the history of nuclear power,  we see the spectrum of human motivations.  Almost all human motivations are present in our nuclear energy processes:   intense professional fear,  high levels of financial gain,  the urge for self protection,  desire for personal aggrandizement or to minimization of criticism, certainly for professional advancement.  For decades these have trumped the need for our civilization to survive.

Thus the core thrust of this blog site.  We must act decisively to keep our technical society in existence.   Do we have the will to succeed?

Charles J. Armentrout, Ann Arbor
2011 May 15,   Addendum, 2011 Jun 3
Listed under    Technology    …  Technology > Fission
Find related posts in the  INDEX tab,under the Banner

________________________________________________

1  I am not certain where this cartoon came from.  I clipped it from a magazine many decades ago and I cannot read the artist’s signature.  It has served as my icon for the nuclear industry since.  I wish I could locate its source, and would appreciate being told its origin.  It is a gracefully drawn, bitingly clear statement of my own personal feelings about  US society as it has existed for most of my life.

Update: 2013 Mar 31 This week I discovered the cartoonist Ed Fisher (not Ed Fischer) used the  signature shown on our dinosaur cartoon, it is in his style, and I now believe it was published  in the Saturday Review of Books (defunct), mid to  late 1960s  .  It is hard to find information about him, but I believe his first name is Edwin and he died in the early 2000’s.    This is not from the New Yorker magazine, and  is not included in any of Fisher’s cartoon sets.  There is no website about Mr Fisher to validate creative authorship.

Update: 2013 Apr 12  New York Times Obituary:  Ed Fisher died On April 3, 2013.   He was 86.
Back to Dinosaur Cartoon 

Posted in Technology | Tagged , , , , , , , , , , , , , , , , , | Leave a comment

Nuclear Decisions 3 – Spent Fuel

Can nuclear reactor waste and spent fuel  from nuclear power plants be rendered harmless to the Earth environment?

The first post in this sequence, Decisions-1, brought up the two top-most safety issues that are associated with nuclear reactors,  (1) loss of coolant for the active reactor core, and (2) safe storage of spent fuel rods and other nuclear waste.

Loss of coolant:   Decisions-2 addressed this – can the nuclear industry cope with a loss of coolant accident (LOCA) without suffering a fuel melt-down, or the threat of one?

There is no technical reason why fuel melt should remain a reactor issue –  an intrinsically safe reactor certainly could be the choice for power generation.  The true issue is human psychology… pride, hubris and willingness to learn from mistakes, to move into new concepts generated by other people.   The result was a qualified yes, we could build safe reactors, but… would we?

Spent fuel disposal:   Nuclear waste is a true danger to everyone on Earth.  I would like to think that there are there techniques that can do for spent fuel what helium gas cooled reactor can do for fuel meltdown –  turn it into a moot point.  I just do not know of any that are tried and true, waiting to be picked up off the shelf.

SpentRodPool_img

Water sequestering of spent fuel in the UK

Right now, all waste products from most reactors are stored in pools of water right at the site of the reactor.  No dangerous underground mines, no dangerous transport, no dangerous burning (or its equivalent) .  Sounds good, right?

If the Fukushima tragedy shows anything, it shows that these waste storage pools are massive threats that sit passively on reactor sites around the world, waiting quietly.

What to do with spent fuel is the central issue for reactor use.  We examine a lot of options and the Post is long.

Index       Click on any of the underlined discussion sections to jump there.

The Waste Problem Nuclear waste is dangerous.
Short History of Nuclear Waste How did we get into this mess?
Long Term Solutions 1 Pool cooling,
2 Dry cask storage,
3 Sequestration,
4 Reprocessing
Summary Put the conclusions together

For a background on nuclear fuel, fuel rods, assemblies, and radioactive waste generation, jump to appendix About Nuclear Fuel .

The Waste Problem

FukushimaH2_img

Burning H2 at Fukushima disaster

The hydrogen gas from the burning Fukushima reactors was surprising:  H2 is not used anywhere, so where did it come from?  The answer is that the fuel rod shells are made of zirconium, which, at elevated temperatures, reacts with water to evolve hydrogen.  Scenario: the reactor walls cracked, the storage pools cracked, the cooling pumps failed to run, the rods were exposed to atmosphere and heated; then they generated hydrogen, which burned.    H2 is not explosive outside a critical region of concentration in air,  but it can generate a fire storm that would spread radioactive materials across the countryside.  This is not idle scare  talk, Fukushima burned.  Fuel rods almost certainly melted.

Used fuel was originally considered to be an easy fix.  It has become the central issue.  Can we would find someplace to safely sequester the waste and live happily ever after?  Does such a place exist?

Short history 

MapToYuccaMt_img

Yucca Mt nuclear respository is near the Nevada nuclear weapon test site

The U.S. National Academy of Science proposed in 1957 that deep underground storage should be the way to sequester the nuclear waste that was being generated by power reactors and weapons manufacture.  What was needed was somewhere that would never have an earthquake threat and be far from water.  After 25 years of technical and political  discussion, President Reagan selected 3 sites for final analysis.

The de-facto favorite was the site at Yucca Mountains, a large ancient earthquake ridge. Yucca  is near Nellis air force base and adjacent to the Nevada Nuclear Weapons Test Site, 90 miles north west of Las Vegas, NV.  After another 20 years, President Bush (II) cut off the analysis.  Nuclear waste disposal at Yucca Mt. was authorized in 2002.  This was to be the location for permanent sequestering.

This has been a highly politicized process.  Evidence that the site was located over the Bow Ridge earthquake fault surfaced in 1995, and one of the tunnel drills demonstrated this in 2007.   In 2009, President Obama killed the entire project.

This reset plans to about 1957.  As of now, virtually all wastes are stored in pools at the place of original generation. The Fukushima disaster shows that this is not a really great idea.

YuccaMtWasteStorage
Proposed nuclear waste underground disposal at the Yucca Mountain facility
YuccaDgm_img

Diagram of Yucca Mt facility

The waste would arrive by rail [1] and deliver reinforced storage containers to the receiving site [2].  Each container would be transported down the main tunnel [3] and into side storage tunnels [4].     As many bloggers have pointed out, something like $10 G  (U.S. billion) had been sunk into the program.

The Yucca Mt Repository is a lovely way to continue to sink money for a long time to come; there is much yet to be done.  Currently, [2] has been built (not out-fitted);  [3] dug; and [4] is TBD.   A major consideration:  The radiation levels would be too high for human entry and all tasks must be fully automated by equipment that must function for at least 10 or 20 half lives of 239Pu (10 or 20 times 24,100 years).   Or, at least the remote monitoring equipment must do so.  Or at least all this stuff must last for as long as our current society stands.  (Those guys in the afterwards can take care of themselves…   Hey! Life is hard all over.)   Back to top 

What are Long Term Solutions?

CoolingPool_img

One of many cooling pools

The U.S. currently has about 100,000 tons of radioactive waste and growing.  We must do something with it.

One kg is 10% larger than 2 lbs; the metric ton is 10% larger than the 2000 lb English ton. For our purposes 10% is insignificant so we will use ton as a generic size.
1  Pool Cooling    This is what is mostly being done, everywhere. Fukushima was an old installation and there were over 1 million spent fuel rods in storage there (see Appendix).  This is calm and quite safe while the water is present, the power is on, and the pool is actively cooled.

All reactors at Fukushima Daiichi lost cooling power and the diesel generator for all the plants flooded.  Apparently all six reactors used a common cooling backup and all were left in trouble when the single system failed.  The rods became uncovered, the zirconium rod shells heated, contacted water, evolved copious hydrogen;  fuel melted.  Why were all systems dependent on the same emergency backup?  It was the cheaper way.

Pool storage is a terrible idea for safe storage over the many years needed to convert radioactive waste to safe but very poisonous trash.  Review Appendix > Spent Fuel > Long Lived Wastes for details on these chemicals.    Back to top 

DryCaskV_img

Dry cask for long term storage

2 Dry Cask Storage At this moment, the best that can be proposed is to

(A) store the spent assemblies in a chilled pool for a couple years (until the assemblies can be removed from water and not melt from their own intense heat).

(B) transfer assemblies  to a cask that has significant neutron shielding in its walls.

(C) interdict forever.

Dry casks in the horizontal orientation would be used at Yucca Mountain, if it were ever completed.

DryCaskTanks_img

Foreground: 2 dry cask tanks at reactor site

Currently, dry cask storage is in use at a few reactor sites in the U.S. and around world.  The technique has proven safe enough if humans are kept a football field  away.

If the currently common UOX fuel is used, the assemblies could be moved to casks within in a couple years.  If MOX is used, as in Fukushima Daiichi Unit 3, a longer time is needed .  It is MOX fuel and bomb wastes that force the true safety timeline for the Yucca Mountain facility to be a on the order of a million years. (UOX, MOX – see Appendix.)

Although dry cask storage is the best sequestration technology currently available, power company executives are reluctant to spring for a dry cask “farm” to store waste products.  I think the fear is that this would solidify resistance to find a better, cheaper (for the Owners) sequestration solution.  Some commentators say it is because there are no regulations that force use of dry cask storage.

Dry cask storage is hugely better than active pool cooling, but not good if the idea is to keep the material out of human hands for the next million years.  We need a truly permanent solution.    Back to top 

3 Sequestration Strategies   These are isolation strategies and would appear to be the simplest.  The basic issue is to find a location that once delivered, the spent fuel will be safe forever.  Many sequestration strategies have been proposed, we will examine 3 variants:  Outer Space, Deep Ocean Deposition, and Underground storage.

Outer Space
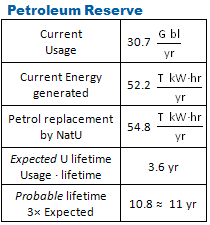
The Delta-IV-H and Atlas-V-H boosters from United Launch Associates are both rated at about 23 tons to low Earth orbit; the SpaceX  Falcon-H is rated at 53 tons.  ULA and SpaceX both publish paths to reach Saturn-V’s capability of 120 t to LEO (the  Saturn-V last flew in 1973).   If we assume 100 t to LEO,  1000 launches would be needed shift 100,000 T of waste from Earth to the ISS.  ULA charges $5,000/kg,  SpaceX targets $1,000/kg ($1M/t).  We need $100 – 500 billion to lift all wastes into the ISS orbit.  And this is just first stop in the journey outwards.

  • Earth orbit  –    We cannot leave the waste near the ISS in LEO because drag from the residual atmosphere would cause all of it to reenter and either disperse in the atmosphere or bombard the landscape as high lethality meteorites.  We are obligated to move the waste on outward.  The LEO first stop, though, would minimize the ΔV required to reach the final destination (and thus the overall cost).
  • Lunar burial –  We could put the waste on the moon, under the assumption that we would never want to operate mining ventures there.  The energy balance is so bad that the cost of lunar burial would far outweigh the gain from the power generation, itself.
  • Solar elimination  –  I keep hearing about shooting waste to the sun.  Hitting sun only happens once we have zeroed the solar orbit velocity out here at Earth’s orbit, a huge fuel expenditure.  Cost is same argument as that opposing lunar burial.
  • Launch failure  –  This is the final, action-stopping argument.  What if lunar or solar prove viable?  I was at Cape Canaveral when one of the high reliability work-horse Delta boosters blew up during launch ascent and made a beautiful carnation high in the sky.  Picture yourself watching one of the monster heavy lifters launch, when you see the lovely bloom as 100 t of nuclear waste vaporize over your head.  How do you feel about being under this blossom?  Now, guess how people in Orlando would react to suggested launches of waste products.

Deep Oceans
This is an attractive option, actually.  Put the casks into the subduction trenches in the ocean and the very earth would transport the waste deep into the mantle, not to reappear for millions of years.  Yet, here there be problems … or at least issues.

  • Waiting time –  Surface subduction  occurs very slowly, and the casks must remain stable in the ocean water for many, many years to come.
  • Safe descent –  How can you assure safe deposition 5 miles down?  An accident as you lower the casks would disperse the radioactive sludge throughout the seas of the planet.  Might make you reconsider swordfish for dinner?  This issue is similar to rocket ascent  into space.
  • Long term stability – These or any of the other deep sea solutions suffer from survivability issues.  Deep ocean beds are mostly very cold, and feature high pressures, with strange pH and dissolved gas concentrations.  How will the storage containers withstand any of the ocean floor earthquakes?  After all, the Fukushima disaster was due to a magnitude 9 quake.    I am not sure that we can detect fault zones as easily as on land, and I would want detailed analysis before we commit to this kind of “forever” storage.  Bore-hole storage has been suggested (a kind of underwater Yucca mountain), but … we can almost drill oil in the Gulf of Mexico, what difficulties would appear when drilling a wide vertical tunnel 3 miles or more under the surface?

Deep Underground
This is the classification for the Yucca Mountain Repository (YMR).

Earthquake_map

M>2.5 for 20 yr period

How can anyone forecast earthquake patterns 1000 years from now?  This cannot be done reliably for next year, even. YMR is over an earthquake fault, as this map indicates.

Nevada ranks third in the nation for quake activity. It is difficult (impossible) to guarantee that YMR will be earthquake free for the next million years, and yet this is what the Repository is all about.  Some geologists are quoted as saying that it is a low risk zone;  how far into the future are they looking?

Would any care to indemnify survivors of a large quake over the next 1,000,000 years?  YMR was suggested because of its supposedly placid existence.   The timelines required for sequestration are so huge that any such a statement is self-invalidating.

The current president took major hits on his decision in 2009, mostly from the right wing paranoids. You can still hear them doing heavy breathing about this.  There are  websites open for business that say this move was to keep waste horribly dangerous so that the left wing environmentalists can have an issue to tantrum against.  Easterbrook (at the site just linked) actually indicates that any source of safe clean power is a terrible threat to these (hated) liberal nuts.

Actually, Obama should be given international awards for his astoundingly far sighted thinking.  This is as opposed to that of the president who started YMR construction while he simultaneously opened war on two separate fronts against religious fanatics who hated each other, and declared an unsuccessful anti-ballistic missile prototype “operational.”  Far right extremists and their comments embarrass any true conservative, who wants to regain our manufacturing power, keep active technology development alive, and build a strong common future for all American citizens.

Sequestration by any technique for a million years or so is a bad idea.  Mostly because no one can guarantee the safety of the stored waste during the cool-down cycle.  The issue is dominated by the number of zeros in the half lives of the elements in the nuclear trash.  (Jump down to the Appendix > Spent Fuel > Long Lived Wastes for a very short selection from the many isotopes generated during the fission process.)   Back to top

4  Waste Usage   This is probably the least popular solution to the nuclear waste problem.  We will discuss 2 paths to use up as much radioactive waste as possible: chemical reprocessing and nuclear transmutation.  For a favorable review see World Nuclear Association.  For an unfavorable review, see Union Of Concerned Scientists.

A. Reprocessing
This is a chemical processing of nuclear waste to extract uranium and plutonium.  The most widely used process is called the PUREX method (plutonium uranium extraction).   Recall that spent fuel is only 3% used up before fission products have poisoned its ability to generate power. The object is to extract the fissionable parts and reconstitute new fuel pellets. With reprocessing, we can use nearly 30% of the fuel in a pellet, without, only 3%.

The spent fuel is dissolved into nitric acid and the final result is about 97% uranium (called RepU for reprocessed uranium), 3% waste, and  1% reactor grade plutonium (RGP is 240Pu and unsuited for bombs, whereas weapons grade WGP is 239Pu).  The RGP can be mixed with RepU to form “mixed oxide” reactor fuel, MOX and made into pellets.  All else is vitrified… combined with borosilicate glass (the original composition of Pyrex®) and made into blocks.  Vitrified waste handles high temperature well and can then be sequestered as desired.

Final comment on a bit of physics that explains how atomic weapons can be made from spent fuel.  If the fuel rod is use only for a short time in the reactor,  238U turns into 239Pu and WGP can be extracted. If it is left for an extended period, the WGP will have been converted substantially to RGP (240Pu).

The US suspected diversion of plutonium or highly enriched uranium to Israel in the mid 1960s from the NUMEC facility in Apollo, PA. (This smuggling has been contested to this day.)  Ten years later, India had reprocessed plutonium for atomic bombs.

To block potential diversion, President Ford issued a directive in 1976 that suspended US commercial reprocessing.  In 1977, President Carter issued an outright ban;  in 1981, President Reagan lifted the ban but did not fund developing any reprocessing plant.  Major reprocessing activity is currently performed in the UK, France, Russia, and the other nuclear bomb countries.

B. Transmutation
Transmutation of waste is sometimes called burning it.  The idea is to naturally accelerate the decay process and turn all the long lived actinides (atoms such as uranium and plutonium) into short lived daughter atoms that can become as radioactive as potash or concrete in a few hundred years.  (Compare with  the million years for some of the actinides.) This is not a reuse strategy as in A but a path to eliminate the material, itself.

Waste is transmuted into safer material by placing it in an intense neutron environment.  The waste atoms are net absorbers of the neutrons, not generators, so this is not a power generation process.  There are too many poisons to cause an explosion, so this is not explosive,  as in atomic bombs. The neutrons cause induced fission and the heavy atoms will break apart into tamer daughter atoms.  There are three processes that we know will work.   Fast neutron reactors, accelerator facilities, and fusion neutron generators.

Fast Reactor – So named because it has no moderator and uses high energy (fast) neutrons.  Waste is placed about the periphery and immersed  in the neutron bath. The converted waste can be used to fuel satellite reactors and generate a net 60% more power from the fuel.  This is a big value added item to the burn-up process.  The down side is that there is a high inventory of plutonium and human greed at any of these facilities.  Though a fast breeder reactor is a huge amplifier for power, it could easily become a conduit for diversion to outside parties.

Accelerator Transmutation of Wastes– ATW would use a proton accelerator to make a lot of neutrons by slamming the proton beam into metal.  Nuclear waste would be arranged about the target as a blanket and absorb most of the neutrons generated.  With enough accelerator shots, the material would be converted from actinide atoms  into much more benign daughter atoms.  I believe an ATW test is being conducted at the Argonne National Laboratory, near Chicago.

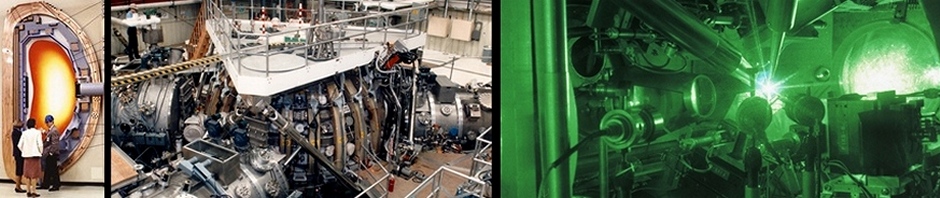
Fusion reactor blankets – The generation of copious high energy neutrons by fusion machines is called the “wet-wood-burner” fusion concept.  This is proposed as a device to generate lots of neutrons but little if no energy.  A  WWB is not a power generator and could have been done anytime in the past 30 years with any of the large machines doing plasma fusion research.  You would use deuterium and tritium as gaseous fuel, heat to the stellar temperatures by current techniques and process the spent fission reactor fuel loaded as a blanket about the fusion core.  Although this may sound similar to the fast breeder concept, no long lived actinide fuel would be used.  Tritium (12 year half life) and locally activated materials are the only radioactive byproducts.

WWB units have been proposed since the early 1970’s when I was a graduate student.  If I had to guess, I would say China or Japan will be the first nation to build a WWB machine to transmute fission reactor waste.    Back to top 

Summary

Radioactive waste production is the hard, bitter core of fission power generation.  Currently we are leaving spent rods in water pools that need actively powered cooling.  The published disasters show this is not sustainable.  We have considered a number of sequestering schemes.   The problem with each is that interdiction must hold for hundreds-of-thousands to tens-of-millions of years.    There is no way we can assure that life on earth could not be eradicated by events at the Repository currently labeled “improbable.”  After all,  improbable events do occur, just not very often.

To misquote Sherlock Holmes:  After you have eliminated all reasonable choices, what is left, no matter how bizarre, must be the solution.  Transmutation is what is left after sequestration is eliminated.  For assurance against nuclear diversion, we must rule out the fast breeder reactors that feed satellite reactors.  This leaves accelerator  beam transmutation, or fusion driven wet-wood burners.  Concrete suggestion:   I suggest using the JET tokamak in the UK (once it has completed its final physics experiments) to run wet-wood-burner tests to  demonstrate conversion efficiency.

click for LastTechAge on fission technology

Bottom line: The  solution  is to eradicate the waste now, during this current era:  Until this becomes our accepted policy, we must not build new reactors.  End of sentence, end of paragraph.

This was to be the final post in the Nuclear Decision chain.  However, there will be at least one more to frame the long discussion into a coherent result.     Back to top 

– – – – –
Update: 2013 Nov 10:   Good infographic from Union of Concerned Scientists here.  Advocates moving all waste storage to dry cask  containment for safer short-term storage.  Absolutely.  But:  be careful with percentages of safety increase using casks.  All engineering estimates are linear guesses.  Real accidents have been confluence of multiple events –  true for reactors,  spacecraft, aircraft, naval craft, etc.  

……………………………….

Charles J. Armentrout, Ann Arbor
2011 May 8
Have a comment? Click on the title of this post, go to bottom, let us know.
Listed under    Technology      …thread Technology8 > Fission
Related posts: Click the INDEX button under the Banner picture

——————————————————————————–

Appendix – About Nuclear Fuel

UO2Pellet_img

Uranium Dioxide fuel pellets

Reactor fuel pellets   are made of uranium dioxide (UO2) and heat sintered into ceramic cylinders.  These pellets are called UOX for uranium oxide,  and handle high temperatures well.  Fissile uranium-235 (235U) is about 3.5% of the total uranium in the UO2.   235U is about 0.7% concentration in natural uranium.  The fission operation converts the abundant natural heavier uranium-238 into plutonium-239, which is quite fissile.

An alternate pellet used is a mix of natural uranium and reactor grade plutonium, 240Pu;  this is called mixed oxide fuel, or MOX.  We will return to MOX later.

FuelRod_dgm

Diagram of fuel rods

Fuel Rods  are hollow tubes filled with fuel pellets. The rods have zirconium alloy walls which resists oxidation as well as stainless steel but is resistant to swelling in the reactor neutron flow, this swelling was discoverd during early reactor operations, led to early incidents and were a really big “oops” for the industry.

Refer to the diagram (from the Nuclear Regulatory Commission).

For numbers, we will use data from a 2010 Japanese presentation on nuclear waste issues at the two Fukushima stations (Daiichi and Daini).

Fuel assemblies   are made up of 63 rods per bundle (Fukushima) and it is these that form the fuel elements in the reactor core.

FuelAssy_Dgm

Diagram of a fuel bundle

Like all else associated with a reactor, this is not an industry standard number.  Other places have assemblies with  other rod counts

After they no longer can generate sufficient neutrons to maintain the required activity, they are removed, said to be spent, and treated as dangerous as waste.

In early March 2o11, Fukushima had 7 pools, six attached to the 10 reactors  (holding 3450 assemblies each and one huge common pool with 6291 assemblies.Some of these have been stored for 20 years or more.

FuelBundleChange_img

Fuel bundle being removed from core

Count:  6×3450 + 6291 is 26,991 bundles.  At 63 rods per bundle, there are in excess of 1.7 M spent fuel rods in storage.

Fukushima is a huge installation, most sites are much smaller. Nevertheless, every fuel rod ever delivered to your friendly neighborhood  reactor will still be on site, waiting.

Spent Fuel   is what remains in the fuel rod after it no longer is able to generate enough power to keep in a working reactor. Fission activity generates isotopes of elements from zinc through the actinides (atomic numbers 90-103).   Some of these are reactor poisons, elements such as xenon, samarium, certain uranium isotopes, many others, that absorb neutrons and stop the fission activity.

Long lived wastes
Depending on the actual fuel used in your local reactor, fission products can have huge half lives.   Here is a small selection:    129I (157,000 yr),  236U (23,000,000 yr),  237Np (2,100,000 yr),  we must not leave out plutonium 239Pu (24,100 yr).  These products are due to to neutron absorption or isotope decay;  they are what we must protect ourselves from.  A duration of five half lives reduces the amount of radiation 32 (=25).  An engineering rule of thumb  is that we should keep these products sequestered for 10 to 20 half lives – for a reduction in radiation intensity by thousand to a million times.

ControlRodsBundles_img

Control rods and fuel bundles moving in the core

Remaining usable fuel
After about 3% of the fissionable fuel has been used, the poison products will have nearly stopped fission reactions;  the fuel assembly must be removed.  To repeat:  spent fuel is 97% good fuel but with enough fission products  to keep  the fuel pellets from producing power.

Back-story of the waste issue
In the US, spent fuel assemblies are never touched again.  They remain hot and dangerous for a very long time and require secure handling/storage for even longer.   The American decision was to reduce the chance of diversion into terrorist hands.  Diversion was not an issue to European and  other countries. These people try to make use of all the fuel, for better or for worse.

Back to the Post index.

Posted in Technology | Tagged , , , , , , , , , , , , | Leave a comment

Nuclear Decisions 2 – The LOCA issue

Why are nuclear reactors not invulnerable to loss of coolant accidents?

Shippingport Img

Shipingport PWR 1st US commercial reactor

A previous post, Decisions-1, asked whether or not the power industry anywhere should use the nuclear option to generate power, thus freeing that country from coal or petroleum dependency. Shown (right) is the first commercial reactor station to generate power in the U.S.

PWR means pressurized water reactor,
BWR means boiling water reactor.

Virtually all operating U.S. reactors are either PWR or  BWR types; PWR’s account for about 2/3 of the units.
The Fukushima Daiichi plant used a first generation  BWR design

Click to move to
The LOCA issue,   Intrinsic safety,   Why is LOCA still with us?

How Reactors Work

Decisions-1 brought u the two top-most issues that are associated with nuclear reactors,  loss of coolant for the active reactor core, and safe storage of spent fuel rods.

ReactorCore_image

Core from KKG reactor, showing key parts

In this post, we discuss accidental loss of coolant.  The image opposite is the reactor core from the Swiss KKG plant, shown in Decisions-1.  We are looking down, into the top of the pressure containment vessel to the top of the core, the grid-like structure in the center of the “bulls-eye.”  The reactor core is seen deeply below the surface of the water used as coolant for the very hot uranium fuel. At least part of the visible blue illumination is generated by radiation resulting from the fissioning of the fuel.  The discussion of coolant requires a bit of understanding of how reactors work.

BWR_dgm_img

BWR digram. The fuel rods are red. Water (the coolant and neutron moderator) turns to high temperature steam as it flows through the core, and drives a turbine/power generator. It is cooled and returned to the chamber.

Reactor Operations
The figure is a very top level diagram of a boiling water reactor.

  • The rounded rectangle is the primary containment chamber.
  • The reactor core is the block with the fuel rods shown in red.  It has 3 functions:  (a) it is a rack to hold  fuel rods, long thin zirconium pipes (in most PWR and BWR reactors) filled with pellets of fissionable uranium oxide,  (b) it provides space for the control rods to be inserted when the reaction is to be slowed or stopped,  (c) it provides flow space about the rods to give access to the coolant.
  • The control rods in a BWR normally are in the chamber base and are driven vertically to enter the core.  Purified water comes into the chamber from the side, flows through the core and becomes high temperature steam.  The steam drives turbines which drive the electric generators, which add power to the grid.

Reactor coolant water becomes somewhat radioactive and is kept isolated.  It is chilled by a secondary heat exchanger, which uses purified water that loops through an external cooling source: radiators at the base of huge cooling towers, or a natural source of water – a lake, river, or ocean.  This final cooler must dissipate a lot of heat energy because inefficient U.S. reactors generate a lot of waste heat.  The cooled water returns to the chamber and starts the cycle again.

In a PWR type such as the original Shippingport reactor, the water coolant for the core is kept in an isolated loop at high pressure and stays liquid;  it never turns to steam.  An additional heat exchanger is required to heat clean water to steam and drive the turbines. The control rods are inserted from the top and in an emergency could naturally fall into the core and turn off the reaction. A PWR plant brochure here.

Modern proposed reactors would be somewhat different – would have higher efficiencies and much better performance than our current crop of machines.

The LOCA issue –  induced core melt down

If for any reason the coolant fails to reach the core (an earthquake-induced crack in the pressure vessel, for example)  a runaway condition may develop, the core heats up, the rod sheath can catch fire, the from fission processes would stay in the core and material components will melt.  It is hard to envision any material barrier against molten reactor fuel; this is the worst case scenario in any failure mode analysis

LOCA in most reactor types would be considered a disaster – the PWR, BWR, liquid metal cooled, the Soviet implemented forms such as Chernobyl’s   RBMK type, all are susceptible.   Not a nuclear critic’s phantom, the issue has been demonstrated by all incidents in the Decision-1 post;  it is truly frightening.

Shippingport PWR pressure vessel, 1956 construction

This should not even be on the agenda!
Core melt-down issues were solved more than 50 years ago.

Really?  So why do problems still occur? Short history: President Eisenhower launched his Atoms for Peace initiative in 1953 and the first power generating station came on-line in 1957 at Shipipingport PA.  This was a rush job. Its PWR reactor design was similar to what the Navy chose for its small size.

This was followed by a mad rush to cash in on the dollar flow to build real atomic energy power plants – clean, non-polluting,  safe power to assure comfort for ourselves and our children.

Browns Ferry Gen-1 BWR chamber (1966-85) similar to Fukushima

The core of the problem: Every U.S.-made reactor, up to the last one built, was experimental, a special (i.e. big) modification of one of the designs.  As such, each is temperamental, each has/had its own distinct problem set with unique special ways to dealing with them.  … This is the message I got from an engineer at the SEFOR Fast Breeder Reactor in Arkansas, when I was considering various professions in physics.

The point: No two units were ever made the same way. This means the set of U.S. reactors pose a threat because standard components are only scattered about here and there. Ok, this may overstate the point a bit to drive it home.  But, of our 100+ reactors, each with 100+ special handling techniques, knowledge of a single unit will not necessarily help much when a  similar event occurs elsewhere.

There are two parts to solving this LOCA issue:

(A) Intrinsic Safety – build reactors that cannot melt even under LOCA conditions,

(B) Continuous Improvement – build each new unit using small steps in improvement over the previous build.  The first unit may be based on the best design possible, but we must be ready to make evolutionary improvements with new builds – not  revolutionary jumps.

Small changes, not large jumps  is one of the LastTechAge basic themes.


Intrinsic Safety – Nuclear history has great successes

Here are 3 historic instances of good practice: TRIGA , CANDU and the HTGR.

TRIGA_img

TRIGA open pool with cerenkov illumination

TRIGA (Training, Research, Isotopes, General Atomic) was the first basically safe reactor sold commercially. This is an engineering research tool, not a power generator, and it is meant to be operated by University graduate students, even undergraduates. The first unit was shipped to a university from General Atomic (San Diego, CA) in 1958 and some 66 units from 200 kW to 10 MW have been sold world-wide. The design has continuously evolved as a highly competent, ever-safer reactor type. Continuous design evolution is the key factor that allows safe, trustworthy machines to be made.  This is true for automobiles, aircraft, ocean liners and bridges, not just reactors.  Although not truly  intrinsically safe, TRIGA provides a lot of time for error correction before any safety issues arise. [1]

CANDU (CANada Deuterium Uranium) is a Canadian power reactor that uses heavy water (heavy deuterium rather than hydrogen in the “H20″ formula) and good design to provide safety. It generated first commercial power in the early 1960’s;  sales  stand at  32 reactors plus 13 CANDU-types in India. Its unique design (heavy water moderator, horizontal fuel rod, special pressurization scheme) make the reactor a highly versatile power generator, one of the best designs in the marketplace. Most importantly (for this discussion) each is built on the lessons of its predecessors. Note that a CANDU unit is not quite intrinsically safe, but its design provides a lot of time for error correction before any safety issues arise.

HTGR (High Temperature Gas Cooled Reactor) is truly an intrinsically safe reactor design.  It is a successful helium gas cooled reactor design that operates with coolant about 800º C, giving the device a nearly 50% thermodynamic efficiency. Coolant leaks in a usual reactor pose the threat of radioactive water in the environment; helium cannot not become radioactive,  helium leakage is not an environmental safety issue for an HTGR.  Helium also confers many engineering bonuses.

If, for any reason, a LOCA event occurs, the temperature at the core will rise, reducing the reaction rate until a balance point is reached between these two.  This is called negative feedback, a term referring to natural processes that dampens the reactor rather than accelerates it.  The unit will reach a high but designed-safe temperature and just sit there. Nothing melts. Nothing explodes. The LOCA response is passive – it requires no outside intervention. LOCA was tested and confirmed at a German HTGR of slightly different build.

The modern incarnations of the HTGR could be good concepts;  they uses a cluster of modules each of which drives the power turbine directly with the hot helium of the reactor. Called the GT-MHR (gas turbine modular helium reactor), or PB-MHR (for pebble bed etc.), they promise the highest efficiency, safest and simplest design of the competing types.

PeachBottom_img

Peach Bottom Unit 1, HTGR 1967-1974

HTGR history:
The company (formally known as) General Atomic made two HTGR units, a small 48 MWe at Peach Bottom near Lancaster Pennsylvania (1967-1974) and a much larger one at Fort St. Vrain (FSV) in Colorado (1977-1989). FSV tried new concepts throughout the entire device. (US practice: each reactor was a major jump in characteristics from predecessors…)

Peach Bottom 1 worked well up to its last day.  FSV history is a great poster ad for small-step prototype development.  There were no nuclear accidents but the manufacturer discovered “interesting” (but unfortunately unexpected) properties associated with hot helium and both the maker and the power company operator discovered that peripheral issues can destroy even a good idea.  In the end,  FSV became functional and fully operational, but the Power Company decided it had had enough and closed the plant. (GA withdrew from reactor sales in 1975.)

Why is LOCA yet an issue? 

The American experience has been to make of one-of-a-type reactors; this generated a track record of a multitude of near misses, and some not so much “misses” as  “caught and contained—this time.”

Why are reactor cores still melting down? The two big builders, Westinghouse and GE, and all the others were bent on BWR, PWR and liquid metal reactors which are intrinsically dangerous.

Was it insatiable lust for personal/family wealth, as some have suggested?  Or, was it hubris, as I believe?  Here, having hubris means to ignore the essential chaotic nature of natural events.   Nothing bad has happened so nothing will.  Time between failures was estimated as many thousands of reactor-years.  Japanese experts were certain of this.  But the base-line truth was that almost every reported major incident has had partial or full core melt-downs.

U.S. nuclear industry operated in its own dream cloud from the 1953 “Atoms for Peace” initiative up until 1979, when the 3 Mile Island  excursion  permanently ended reactor construction.  If the big builders had been able to get development support from the government, might they have built intrinsically safe plants?

Bottom line 

click for LastTechAge on fission technology

LOCA should not be a show stopping issue for reactor builds. The issue causing core melts is human nature, not fundamental technology.  There are examples of good practice with well thought-through machines that show that we could have made reliable, safe power generators, if the makers had so wished.  We cannot power our society with forest wood or whale oil.  We  do need some kind high energy density, high power source to keep our cities lit.   Let our choice be in the right direction.

……………………………….

Charles J. Armentrout, Ann Arbor
2011 Apr 20,    Minor additions, 2011 Jun 03
Listed under    Technology    … thread Technology > Fission 
Have a comment? Click on the title of this post, go to bottom, let us know.
Related posts: Click the  INDEX  button under the Banner picture

————————–
[1] Personal disclosure: I was a physicist at General Atomic in the 1970’s and 1980’s, working on the Doublet III tokamak fusion test bed.  I moved on about the time the “s” was added to the name, the first time in history the adjective atomic (as with energy) was made plural.  I worked in plasma fusion physics;  I was never involved with fission reactors.   Back to Intrinsic Safety

Posted in Technology | Tagged , , , , , , , , , , | Leave a comment

Fukushima and Reactor Decisions 1

Japan’s Fukushima Daiichi reactor complex has been headline news since the earthquake and tsunami led to a partial melt of the enriched uranium fuel in at least one of its reactors.

How we humans have used energy generation technology is one of this blog’s core topics, its reason for existing.  In this series of posts, we will use the Fukushima Daiichi horror and other terrible incidents to discuss whether nuclear fission reactors should be considered a reasonable choice for meeting world energy needs.

The Fukushima installation has 6 power generating reactors, R1, R2, and R3 were generating power and 4, 5 and 6 were off-line and considered safe. R1, R2 and R3 all had major overheating of the reactor core when (a) power failed, then (b) the emergency backups took a minute to come to full power. That response time delay was sufficient cause run-away temperatures in the fuel rods and caused major damage. Part of the damage was to the water cooling system for the spent fuel rods.

The full extent of the damage is still being assessed, 3+ weeks after the event and it is not yet clear whether or not the spent-fuel rods in the 6 storage ponds have experienced an overheating incident, too.

Acronyms:

LOCA Loss Of Coolant Accident BWR Boiling Water Reactor
PWR Pressurized Water Reactor FBR Fast Breeder Reactor

Reactor Fuel: As with all reactors worldwide, uranium fuel is packaged in long tubes (fuel rods) of special zirconium alloys. When the fission activity drops below a level for efficient power generation, the rods are removed to a nearby (on site) storage volume similar to a swimming pool. Here, they kept underwater for years, until the self-heat from the residual fission can no longer melt the casings. Although not a “core melt” because it is in the storage pond, overheating of spent rods can generate severe issues in the world ecosystem.

FermiReactor image

Fermi Reactor Station, site of 1966 fuel rod (in core) melt

3MileIsland pix

3 Mile Island, site of 1979 partial core melt

There are four well-known historical events where the reactor core lost coolant, causing the fuel to over heat and melt the rod casings. In at least one overheating incident, the molten fuel dripped down onto the concrete floor, causing the concrete to evaporate. If the entire fissile core were to melt, it is hard to envision what could dissipate the molten bolus of material. The fanciful picture is of a mass that melts “straight down to China” when viewed from U.S. locations. No ‘China Syndrome’ as yet; the human species has been lucky.

1966, Oct 05 – Fermi Station
Near Detroit MI. Unit 1, an experimental 94 MWe liquid sodium cooled FBR, suffered LOCA and some fuel rods in the core melted. During the past 45 years the events have been variously described as straight forward containment event of a fuel melt situation, or an event that nearly destroyed Detroit.

Chernobyl_Reactor_Image

Chernobyl R4, Ukraine. Partial core melt

1979, Mar 28 – Three Mile Island.
Near Middletown PA. Unit 2, a 430 MWe PWR, experienced operator error causing a LOCA event leading to a partial core melt. The problem was contained within the safety enclosure. The 3-Mile incident is frequently cited as the reason that no reactors have been built in the U.S. since this time.

1986 Apr 26 – Chernobyl
Near Pripyat Ukraine. Reactor R4, a 1 GWe graphite moderated BWR unit, suffered a LOCA event during a coolant safety test and the graphite moderators caught fire. This caused massive contamination in Ukraine and Belarus. A concrete ‘sarcophagus’ was built over the damaged reactor to block further radioactive contamination.

Fukushima_Image

2011 Mar 12 – Fukushima Daiichi
Six BWRs generating 4.7 GWe power are located near Fukushima, Japan. This station experienced a LOCA after a 9.0 magnitude earthquake and related tsunami. Although units 1, 2, 3 and 4 are clearly in trouble, this is an ongoing incident and, more than 3 weeks later, the the full extent of the issue has not been determined.

This list is not comprehensive but does illustrate that the major concerns with a reactor are with its cooling strategy. If the cooling process is stopped for even an instant, a major incident could develop.  LOCA-type events, such as the 4 just described, have been considered as an important failure mode since the start of the reactor age.

Right now, as oil production peaks in the world, there is strong interest in power generation free of CO2 emission, one not relying on hydrocarbon combustion.

KKG_reactor_img

KKG reactor is a 1020 MWe PWR in the north part of Switzerland

There is renewed attention in nuclear power as an energy source.  Here is the KKG pressurized water plant in Northeast Switzerland, showing the reactor’s confinement dome, its huge heat exchanger stack that removes heat from the circulating water, and (to the left of the dome) the reactor’s waste gas stack that allows release of radioactive biproduct gases into the atmosphere.  As with most reactors, it is by a river for extra cooling water, when needed. (Some plants, such as the one at Fukushima Japan are near an ocean and do not need the huge cooling tower structure.)  This is a top down overview of a reactor power station.  The questions is:   Should power production “go nuclear?”

click for LastTechAge on fission technology

I see two major obstacles to responsible deployment of fission reactors.

First is the danger posed by loss of coolant leading to core melt down.

Second is the safe storage of spent fuel.  The spent fuel issue has been the object of wishful thinking up to now.  No viable solution exists at this time.

These two issues are the subject to the next two posts.

Update:  12 Apr 2011: Fukushima Daiichi has had its incident analysis upgraded from the initial IAEA INES accident level 5 (Accident with wide consequence but limited radioactive release) to INES Level 7 (Major Accident, with large release of radioactive material and potential major environmental impact).  Fukushima Daiichi joins Chernobyl as the only Level 7 events recorded.

Note the Three Mile accident was a Level 5 and the Fermi-1 accident has not been classified.  IAEA = International Atomic Energy Agency; INES = International Nuclear and radiological Event Scale.

Charles J. Armentrout,  Ann Arbor
2011 Apr 08,    Minor addition: 2011 Jun 03
Have a comment? Click on the title of this post, go to bottom, let us know.
Listed under    Technology    …thread   Technology >   Fission
Related posts: Click the INDEX button under the Banner picture

Posted in Technology | Tagged , , , , , , , , , , | Leave a comment

Light Switch or Thermostat?

Over the past month or so Wisconsin Gov. Scott Walker demonstrated how people like to view issues as a choice between opposites.   The new Republican governor there thinks that unions are bad, not indeterminate, and certainly never good. He wants to end collective bargaining and  eradicate unions.  A couple of weeks ago, Paul Krugman had a  column in the New York Times (2011 Feb 21).  Per Krugman, eradicate unions and return to oppression and enslavement —  eradication would empower a new oligarchy of the ultra-rich.

Think of a light switch. Flick it up, lights are ON, flick it down, lights are OFF.   Nothing in between; a dichotomy of choices.  People feel comfortable with this.

Light Switch OFF

Light switch set to OFF

Does Mr. Walker and US Republicans believe that all Unions are simply destructive, do nothing but block the advancement of Free Enterprise?  Maybe. This way, folks who work become a conceptual light switch.  Walker’s campaign is to stand up for pure Good against the purely Evil.  U.S. Democrats (and others) see it the same way, but with reversed identifications.

I suspect that Walker would never admit to wishing a return to the golden days of yesteryear, the late 1800’s when a worker’s choice might be plunging ever deeper debt at the company store, or was not surviving.  A century ago, the Muckrakers saw this choice in those bipolar terms.  They added other dichotomous choices:  would your children’s food help them grow or stunt them?  Would medicine heal you or kill you?  Would workplace conditions kill you if you blinked at the wrong time?  Then, as now, such light switch choices are easy to visualize; people respond strongly when something can imaged this way.

When you phrase something in the manner done here,  it is polarized. It reduces things complicated to things understandable.  Comfortable, but truly accurate? Maybe not, but is there a better way to describe issues?

Thermostat image

Thermostats for continuous choices

Consider the thermostat. Would anyone set the house temperature to it fullest maximum on the dial?  Or all the way down to 0 on the dial?  Do you really want to live in a room where butter melts on the table … or shatters?  Living temperature is not an OFF/ON issue.  Temperature should be set to an intermediate value, then continuously adjusted so that small variations will not run away to extreme values.  Could at least some issues could be better phrased as a thermostat setting rather than as a toggle switch?  Unions might be good case in point.

Light switch ON: Labor unions are the workers’ only shield from the voracious owner class, and must be allowed what they need and demand.  Else, we spiral back into the 19th century.

Light switch OFF: Labor unions are run by near-criminals, exist to acquire power and must be stopped before they choke off enterprise and we all lose our motivation to excel.

This two position switch has polarized US politics for nearly a hundred years.

My Analysis: Both switches illuminate truth at some level.  Labor unions serve a deeply important function by keeping members from becoming enslaved to the ultra-rich.   They also nearly all became institutionalized;  mirroring the corporations in organization and member control.  They start up through struggle and achieve good; they age through internal struggles for personal objectives.

Actually, unions should operate as a social thermostat.  If fully OFF, society will freeze over with the wintry blasts of greed.  If fully ON, society could split or stagnate from conflict between institutionalized corporate management and institutional unions.  An institutional union makes as much sense as an “institutional revolution.”

A thermostat is the metaphor for intermediate settings, a middle path that could hold the condition at a point of least discomfort.  Thermostats work best when they provide small adjustments to counter small changes in condition, not just send a static signal for control.   In this light, unions really should function as thermostats, they should exist and they should allow for adjustments in the status of the workers to meet current conditions.

Some issues may truly be light switch dichotomies: blinding brilliance vs numbing darkness: Should companies evacuate Kalamazoo MI, frac the underlying shale to extract natural gas? Though most issues are not binary choices, people often label conflicts for their own reasons.

Thermostat OFF image

Thermostats can be set to OFF too

•  News media workers try to polarize all issues to (A) simplify them and (B) generate good sound bites for increased readership.  Think about the questions on talk shows that polarize discussions …  they generate hot anger and discourse malfunctions (a stimulatingly over-the-top statements).

•  Ideologues polarize issues so that their side is Right and the other is Wrong, maybe even perpetrated by evildoers.  Unrestrained enterprise would be our salvation if the nasties did not block successful people; or central decision planning would make enterprise distribution fair at last, if venal people did not undercut it.  Or

•  Theologues are ideologues whose cause is the Supreme Being of the Universe.  I find these guys the most scary of all: Theologues say to themselves “I am on the side of Ultimate Good, Perfect Beauty, Radiant Light.  Those opposed are against all those things and must be on the side ultimate Evil, deepest Ugliness, the most consuming Darkness in the universe.”  A theologue will see no true limit to what is reasonable to support Good. No violence is too extreme when applied against the devils serving the Over-Lord of Ultimate Darkness.  … think Christendom’s experience with its own Holy Inquisition.

“I would remind you that extremism in the defense of liberty is no vice.”  Ideologue Barry Goldwater said this nearly 50 years ago – and meant it.

(Were Sarah Palin and Glenn Beck ideologues or theologues when they published pictures of disliked people with targeting grids shown over their faces?)

click for more posts on the general direction of our society

Light switch vs thermostat issues, this is the subject for this posting.  Such attitudes can have a real effect on social cohesion.    Later, we will explore how these ways of describing issues relate to the chaotic fluctuations the permeate our existence.

………………….

Charles J. Armentrout, Ann Arbor
March 18, 2011
Listed under    Economics 
Find related posts on
INDEX tab under the Banner 

Posted in Economics | Tagged , , , , , | Leave a comment